The Geospatial Convergence: How GIS and Remote Sensing Technology Revolutionized the Study and Practice of Archaeology
(Image courtesy of archaeology.org)
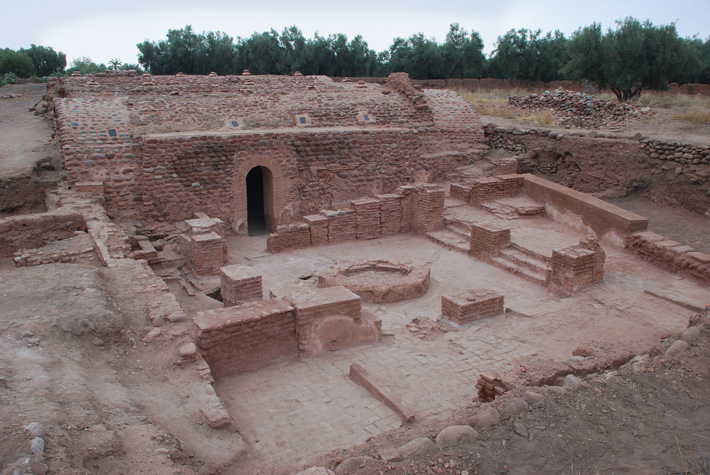
Since their initial convergence in the 1980s, the advent of remote sensing has revolutionized the way today’s humans learn about those from the past by allowing modern archaeologists to find signs of ancient civilizations where others could not.
Thanks to satellite imagery, on-the-ground LiDAR technology, and GIS, ‘remote sensing,’ or exploring a site without excavating it, has become standard practice in archaeology. The ability to examine areas that are not geographically close to researchers optimizes the process and makes exploration more efficient.
Some remote sensing can be done from the ground via Ground Penetrating Radar (a radar device dragged over a site to provide rough structural images) or Geophysical Diffraction Tomography (which shoots soundwaves into the ground from a shotgun), but much is done from above.
Aerial views in the early 1900s of places like Stonehenge were precursors for today’s marriage of geospatial imaging and archaeology. The relationship was cemented in 1981, when NASA’s SIR-A imaging system was launched, using reflected sunlight to create images. When it was flown over an archaeological site in the Sahara Desert, the driest place on the planet, SIR-A sent back underground images of a landscape that had once been the site of many lakes and rivers. The riverbanks revealed by that flyover proved rich in prehistoric tools and other artifacts.
Seeing things from above is one thing, but seeing them in infrared and other wavelengths not visible to the human eye is another. Infrared imaging technology is the second way geospatial information has proved invaluable to uncovering humanity’s past.

The satellite image on the left shows only visible sand dunes, while Spaceborne Imaging Radar, also known as SIR, was able to detect an ancient river bed beneath the sand dunes. Image courtesy of NASA.
Buried structures affect how things grow over them, and infrared imaging can help detect these clues. Heat emission varies for materials like rock, sand, flora, and cultivated soil. Human enterprises, like farming or construction, change the heat signature of the land. Observed temperature variations in the soil can reveal texture differences, which, in turn, can point to the potential of past farm fields. Rock, for example, absorbs more heat than soil, so hotter temperatures in soil may point to buried stone structures. Archaeologists were able to find the Maya causeway (early types of human-made roads) because its infrared radiation was observed at different wavelengths than the plant growth around it.
Computers programmed to seek out these outlying heat signatures allow for a much larger swath of land to be surveyed, while LiDAR gives archaeologists a fantastic tool for finding evidence of human activity once sites are identified. Archaeologists can now reliably detect everything from anomalous forest structures to underwater shipwrecks without ever breaking ground or donning a wetsuit. This is especially helpful in urban environments, where modern civilization has grown over the old and won’t allow for excavation.
Finally, large-scale databases help organize and analyze historic sites from around the world, leading to new insights from old finds. Patterns and predictive models can be made from the resulting analysis and used to further research human history. To pinpoint a new potential site, factors like proximity to water, other cities, or even information from old paper maps are all considered.
Key Takeaways:
- The relationship between GIS and archaeology goes back to the early 1900s.
- advances in GIS data have helped archeologists survey land for sites, using infrared imaging and LiDAR to find anomalous forest structures.
- The diverse datasets provided give new insights to ‘old’ discoveries and the data needed to create predictive modeling for focused searches.
Geospatial Terms Made Easy: What Are Map Features and Layers?
Features and Layers are the basis of all modern maps. Adding them is the first step in the cartographic process, and with the right data, they can help to visualize elements that have never been seen. We asked Elliot Young, a Global Census Archive Analyst at EVG, to go into detail about what map features and layers are as well as their importance.

“Map features/layers are how GIS programs organize the grouping of vector and raster data used to visualize data on a map or screen. These are the features that are often shown in a Table of Contents or legend and often have options for editing and visualization. These layers can range from something as simple as roads to something as complex as a feature that represents a geographic area where a certain language is spoken. Certain features can be toggled on or off to show exactly what data you want to display at any given time. Layers are one of the most elemental features of maps, but some of the most important. Without the right layers, you won’t be able make the map, as layers are essential to visualizing the data you wish convey.
When crafting one of EVG’s many Census products, we are often combining data that is normally seen in tables or spreadsheets. With map features and layers, we can show multiple population and housing variables by organizing, combining, and visualizing to show correlations and relationships that are hard to conceptualize when not being viewed spatially. This transformation from spreadsheet data to visualized data can help researchers and professionals see patterns and trends they may not have been able to see previously. This is just one example of why having the correct map features and layers is so important. “
We work tirelessly to ensure we provide the most accurate data, cartographic products, and custom solutions for our clients. We offer a wide variety of off-the-shelf products and we are more than happy to work with you to get the exact geospatial solution you need. Contact us to find out more.

Elliot Young, Global Census Archive Analyst
The Geospatial Convergence: 5G and the Future of Wireless Technology

(Image Courtesy of PCMag)
All types of technology are constantly evolving in today’s fast-paced world, and wireless technology is no exception. 5G, the fifth generation of wireless technology, will soon be as ubiquitous in the real world as it is in tech writing. With the ability to move more data more quickly than previous generations of wireless tech, 5G will empower everything from smartphones to autonomous vehicles and smart cities. The technology is as capable of enabling a machine to quickly download plans to fix itself as it is loading a movie onto a phone.
Whether in New Delhi, New York City, or Newfoundland, geospatial data and information are crucial to 5G network rollouts. Well-planned, expansive networks are required for this technology to work seamlessly, because, along with its benefits, 5G brings a set of challenges that require detailed and dynamic geospatial data and information to solve.
5G waves are shorter and denser than those of 4G. They can be stopped by a hand, wall, or a palm branch in the breeze. A general rule-of-thumb for 5G connectivity is a line-of-sight from one antenna to another, meaning networks are built with more base stations, in closer proximity, than previous communication infrastructure. In rural areas, this will mean building new towers, while in urban areas, designers will attach antennas to existing buildings. This points to an instance of location data being crucial to the success of 5G; to install an antenna on existing structures, land ownership data will need to be considered.
Location data has already helped cities and communities build themselves in smarter ways. Using that existing information to implement 5G is a logical step, and GIS companies are providing both unique and existing data to the telecom industry. Geospatial analysis can go beyond physical details of cities and landscape; it can also provide insights on the people, weather, and vegetation that live in them. This data provides radio engineers and network designers a deep understanding of factors that could impede signal reliability. Consideration of things like pedestrian traffic, planned construction, seasonal plant growth, and even risk for natural disaster all adds to the stability of the 5G network. Seeing those factors in one geovisualized image is invaluable.
Existing land use and coverage maps give one part of the picture, while high-resolution data, such as LiDAR technology, which is already being put to use in autonomous driving can provide designers with real-time updates and hyper-detailed imaging of the city they are working in, even at different times during the day or across a period of time. If a distance between two base stations or antenna is too great or interrupted by a signal-blocking element, alternatives can be devised. LiDAR’s accuracy allows for these adjustments and tests to occur on virtual site visits and field simulations, which keeps costs, delays, and surprises at a minimum.
As 5G networks go live, geospatial data will help companies keep track of where signal strength falters. This gives them the ability to respond in real-time to the needs of their customers, while providing the data needed to address the problem at its root.
Key Takeaways:
- 5G networks require more antennae in closer proximity because its waves are shorter and more easily blocked than previous technology.
- GIS data allows designers and engineers to design and test networks around potential signal-blockers, no matter how small a factor they may seem. This ensures that the most reliable network is built the first time around.
- LiDAR’s ability to update maps and databases in real time and in great detail allows for a greater ability to react proactively to developments that may threaten network stability.
Geospatial Terms Made Easy: What is a Digital Elevation Model?
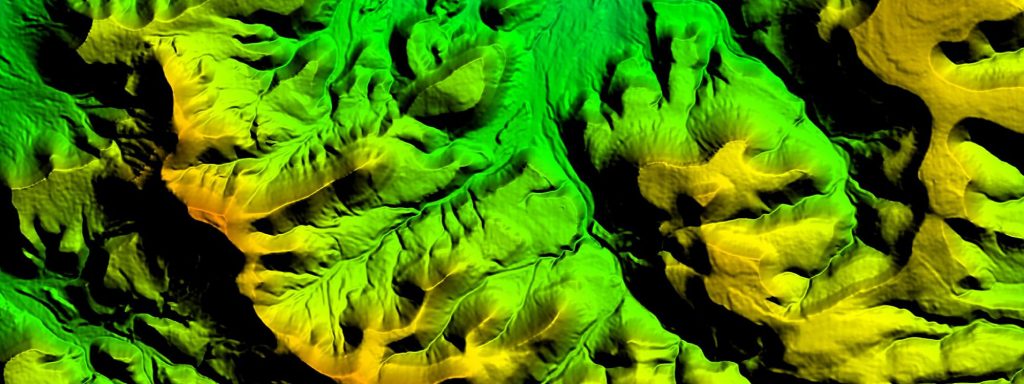
(This is an example of a Digital Elevation Model, made in-house at East View Geospatial.)
At East View Geospatial, much of the work we do is project-based and involves helping our clients better understand the physical terrains of their areas of interest (AOIs).
Digital Elevation Models, or DEMs, are frequently vital data inputs in that process. We asked our Senior Account Manager, Jerod Fink, to break down what DEMs are and to go over how we utilize them here at EVG.
“A Digital Elevation Model (or DEM) is a 3D representation of a terrain surface. DEM data is displayed as a grid, usually represented in meters. This data utilizes an elevation or Z value at the center point of the grid cell to indicate height above or below sea level (in bathymetry data), or an ellipsoid. Grid cells can vary from 1km square to less than a meter square. The lower the grid spacing, the higher resolution, and thus more accurate and detailed a dataset becomes. High-resolution DEMs have many uses across all different industries, especially for different types of planning.
DEM is an overarching term for elevation data which can be further defined into two types: Digital Terrain Models (DTM) and Digital Surface Models (DSM). DTM heights represent bare-earth terrain. With corrected hydrographic features, rivers flow downhill, and the user can get a very accurate representation of all-natural terrain features.
Digital Surface Models (DSM) incorporate the built-up environment above the terrain in their values. For example, buildings, bridges, tree canopy and other vegetation heights.
DSMs are used widely in pipeline planning, mobile network development, and population movement studies. DSMs are of particular use to the airline industry (both civilian and military) for obstacles and terrain avoidance systems.
DTMs, on the other hand, are used widely in the planning of smaller areas where terrain details are of utmost importance. A few of the specific areas where DTMs are widely used are road development, ski resort construction, oil and gas pad construction/maintenance, and particularly flood mitigation.
Accuracy in planning is key- businesses need extremely detailed and specific data to ensure that time and resources are utilized in the most efficient way.”
At EVG, we provide both off-the-shelf elevation data as well as produce custom elevation models in-house so they can be tailored to our clients’ exact specifications. We are your GeoConsultant and will work with you to find the right product or solution to meets your needs. Contact us to see how we can work with you today!

The Geospatial Convergence: How The Sports World is Embracing GIS Data For Strategy & Planning

(Image courtesy of The Atlantic)
In any domain, a strategic advantage is a prized asset. On fields of sport, especially at the professional level, where strength and skill are often equally matched, a strategic advantage can mean the difference between a winning record and a losing one.
Athletes, coaches, and team owners are finding ways to empower their missions with geospatial data. Some of their uses are to be expected, like tracking distances and speeds of runners or dogsled racers. Others are used to uncover hidden advantages.
One of the best examples of this is travel planning for teams. In general, the more a team travels, the more prone to injury their players are. In the 2015-2016 NBA season, for example, the most travelled team, the Golden State Warriors, reported more injuries than the least-travelled team that year, the Cleveland Cavaliers. With geospatial information aiding decision-making by league executives, this is the kind of problem that can be smoothed out league-wide, evening the competitive field.
Speaking of fields, a player’s activity on them during a given game or match can reveal much about their strengths. Detailed break-downs of an athlete’s habits and successes, like this one conducted by Esri for a match between Roger Federer and Andy Murray, can help hone specific skills. The data linked above, for example, combines court position, ball bounce, point outcome, and opponent responses to give an incredibly detailed analysis of what occurred.
In team sports, like soccer, that kind of information can be used to predict how opponents will react to a player in each in-game scenario. Coaches can use this information to add an element of psychological advantage to their strategies, by deploying players at advantageous moments. They can also use this to gain an accurate statistical picture of who the most valuable players are. These kinds of micro-data points lead to far more understanding of a good performance than mere point totals.
Of course, GIS data can be used to examine far more than a few individuals on a sports field. Team and league owners are using cross-referenced geospatial and population data to determine where to build stadiums, which stations to air games on, and even which cities to move teams to.
Finally, sports use the kinds of applications more traditionally associated with GIS in distance-based events, like the Tour De France and Iditarod, to track and map participants. This allows viewers worldwide to track their favorite participants in real-time. The more accurate the data, the more nuanced a picture of their performance we can see.
Key Takeaways:
- GIS data can help athletes and coaches with small-scale strategy and predictive models for opponent behavior, as well as their own.
- Leagues and owners use the information to ensure their teams play to the biggest and most enthusiastic markets.
- Non-athletic advantages, like a more moderate travel schedule, can be identified and mitigated, ensuring as fair a competition as possible.