East View Geospatial
FAQ
General
What options and services are available?
East View Geospatial offers tailored solutions through three services:
- Data Acquisition – Staying current with evolving data can be both time consuming and complex. Let our global team of experts simplify the process for you. We’ll ensure you receive the most accurate and relevant information presented in a language you can understand.
- Data Production – Leveraging our extensive in-house data and global sourcing capabilities, we provide you with the most comprehensive information available. Our diverse range of industry solutions ensures that the data is delivered in the precise format you need.
- Data Delivery & Management – Managing and organizing physical content demands both space and a systematic approach. We have decades of experience in helping our clients make the most out of their data.
How has East View Geospatial amassed such a large global inventory of charts, maps and GIS data?
East View Geospatial maintains relationships around the world with national mapping agencies and other data publishers. We work directly with those agencies to buy maps, charts and geospatial data on a regular basis.
Does East View offer analytical services?
Yes, we have a magnitude of analytical services to help you make smarter and faster decisions at scale.
How soon will I get my map/chart?
Charts typically ship within two business days of the order. This may be affected when an order is placed outside business hours or around company holidays. Please allow 1-7 business days for items such as vector data. Due to the customizable nature of vector data, we may not have an off-the-shelf product ready.
Are older editions/published years available?
We work hard to ensure you have the data you need. Not all publications have older additions available, but we can provide older editions when applicable.
Can I get a preview/sample of the map?
A preview can be provided for most publications upon request.
Pricing
Do you offer a discount for bulk orders?
We offer discounts on a case-by-case basis. It’s not a standard offering for all clients but is available when it aligns with our capacity and your requirements.
Is anything available for free?
Regrettably, we do not offer complimentary products. However, we strive to make our pricing fair and transparent.
Print On Demand
What are the different paper types and qualities of each?
- Premiere Bond (32#) – Ultra-white and quality prints. The most economic choice
- Paper Tyger – Economic, water resistant, and tear resistant
- Polypropylene Film (8mil) – Weather and water resistant with a very smooth texture similar in nature to laminated paper. Feels like a poster
- Tyvek – Premium ultra lightweight paper type that is durable, tear and water resistant. Slightly dims colors and similar feel to tissue paper
- Magic DMIBOP – Durable premium waterproof paper, tear resistant, latex-based with nylon reinforcement, wet strength paper ideal for indoor banners and wall coverings
- Canvas – Flexible, durable water-resistant polyester blend canvas, ideal for stretching
- Premium Matte WR Vinyl with Adhesive – Thick matte vinyl with adhesive backing that is water resistant with a smooth matte finish
Additional services such as lamination and framing are also available
- Gloss Laminate (3mil) – Clear glossy laminate that is durable, tear proof, and economic. Waterproof if encapsulated and reflects light. Great choice for dry erase use and a lighter alternative to framed glass
- Matte Laminate (3mil) – Thick matte laminate that is firm, durable, tear proof and better clarity than gloss. Waterproof if encapsulated and absorbs light.
- Oak Wooden Hanging Bars – Long strips of wood adhered to the top and bottom of the media for a rustic look
- Framing – We have frames in standard arch sizes, B to D, with white, black and espresso (brown) colors
- Foam Board Mounted – 3/16” board that media is adhered to. Unbendable, but a good customization option for hanging wall media, can be put into frame as an add-on
What are the physical dimensions or file sizes of a typical map?
Map sizes vary significantly based on the type of map, the country of publication, and the scale of the map. Below is a matrix of map sizes for all of our United States and Soviet global topographic maps and nautical chart series:
American Global Series
| Scale | Name | Dim. (in) w x h | Dim.(cm) w x h | Avg. File Size (TIFF) |
| 5 M | GNC | 57.5 x 41.25 | 146.1 x 104.8 | |
| 2 M | JNC | 57.25 x 41.25 | 145.4 x 104.8 | |
| 1 M | ONC | 57 x 41.25 | 114.8 x 104.8 | |
| 500K | TPC | 57 x 41.5 | 114.8 x 105.4 | |
| 250K | JOG | 29 x 22 | 73.7 x 55.9 | |
| 100K | TLM | 22.5 x 29 | 57.2 x 73.7 | |
| 50K | NIMA | 29 x 22.5 | 73.7 x 57.15 | |
| Nautical Charts | NGA/NOAA | 36 x 48 | 91 x 122 | 250M |
Soviet/Russian Global Series
| Scale | Dim (in) w x h | Dim (cm) w x h | Avg. File Size TIFF | Avg. File Size ZIP |
| 1 M | 28 x 22.75 | 71.1 x 57.8 | ||
| 500K | 26.5 x 23 | 67.3 x 58.4 | ||
| 200K | 17.25 x 17 | 43.8 x 43.2 | ||
| 100K | 21.5 x 17.5 | 54.6 x 44.45 | 58-70 Mb | 18-28 Mb |
| 25K City Plan | 23 x 18.75 | 58.4 x 47.6 | 50-80 Mb | 15-30 Mb |
| 34.25 x 27.5 | 87 x 69.9 | |||
| 53 x 34 | 134.6 x 86.4 | |||
| 10k City Plan | 45 x 35.5 | 114.3 x 90.2 | ||
| 27 x39 | 68.6 x 99.1 | |||
| GUNIO Nautical Charts | 110 x 76 | 43.3 x 29.9 |
Are “Paper Products” originals, copies or both?
“Paper Products” are defined as original lithographs or high-resolution plotted copies. East View Geospatial has built an extensive in-house collection of original lithographic prints from around the world through ongoing procurement from national mapping agencies. Over the past few years there has been an increasing trend of national mapping agencies supplementing original lithographs with plotted copies. For this reason East View Geospatial can not guarantee that orders for paper will be filled with original lithographic prints and will supplement with plotted copies. This will not affect the price.
Shipping & Returns
What are the continental United States shipping options and rates?
For continental United States destinations, orders are shipped standard ground, second day air, overnight, or FTP.
We will select the most appropriate courier depending on the method of delivery you choose.
All Products (per order)
- USPS Continental US Ground (5-14 days): $9.95
- UPS Continental US Ground (3-7 days): $11.95
- UPS Continental US 2nd Day Air: $24.95
- UPS Continental US Next Day Air: $49.95
THERE IS NO CHARGE FOR FTP.
What are the shipping rates for Alaska and Hawaii?
All Products (per order)
- UPS Alaska and Hawaii Ground: $29.95
- UPS Alaska and Hawaii 2nd Day Air: $49.95
- UPS Alaska and Hawaii Next Day Air: $69.95
THERE IS NO CHARGE FOR FTP.
What are the international shipping options and rates?
For other North American and international destinations, orders are shipped worldwide express or FTP. We will select an appropriate international courier for the delivery area you specify. Note that some products cannot be shipped to international destinations. Products will generally be shipped via UPS but we also ship via FedEx and DHL depending on the destination.
All Products (per order)
- UPS Ground – Canada: $29.95
- DHL North, Central, South America 3 to 5 Day Air: $109.95
- DHL Africa 3 to 5 Day Air: $149.95
- DHL Asia 3 to 5 Day Air: $69.95
- DHL Australia and Oceania 3 to 5 Day Air: $84.95
- DHL Europe 3 to 5 Day Air: $99.95
- DHL Middle East and India 3 to 5 Day Air: $94.95
THERE IS NO CHARGE FOR FTP.
Important Note for International Destinations
Your packages may be subject to the customs fees and import duties of the country to which you have your order shipped. Any customs or duty charges are always the responsibility of the recipient.
Can I request specific packaging or shipping instructions?
Customers may request alternatives to the above options as well as special packaging. East View Geospatial will do our best to accommodate all custom requests. Please understand that any additional costs will be the responsibility of the customer. Please add 3 days to delivery time for all special requests.
What is the return policy?
East View Geospatial, Inc. stands behind our products. If an item arrives damaged or a file download is corrupt, you may be entitled to a refund if within 48 hours of download notice or package arrival you contact us to contest.
Unlike most retailers, we also guarantee the product selection advice offered through our website and staff. If an item you’ve purchased based on this advice turns out to be unsuitable, you may be entitled to a refund.
Exceptions to East View Geospatial’s return policy include:
- Consumer negligence, including inability to use proper software required to view and download product.
- Failure to notify within 48 hours of data corruption or damaged product.
- Failure to supply proper documentation of East View Geospatial oversight.
If you have any questions about our guarantee, please contact us.
Refunds
Refunds may be issued in the event that East View Geospatial:
- Is not able to procure a product.
- Has failed to meet stated project deadlines.
- Has supplied the wrong selected product or files are deemed corrupt.
Contact us if you wish to request a refund.
Please note: Returning product to East View Geospatial via USPS, UPS, DHL or FedEx does not ensure a refund if prior arrangements have not been made.
Returning by Mail
Within the US: Returned items must be sent via insured, prepaid regular US Mail (USPS), FedEx or UPS. Insuring your return allows you to track your parcel with the US Postal Service, FedEx or UPS. Please Note: We cannot accept CODs or courier deliveries.
Outside the US: Ship goods prepaid, by insured ground shipping via DHL, FedEx or UPS. To avoid unnecessary delays, please write “U.S. goods returning” on the outside of the package.
Please return to:
East View Geospatial, Inc.
10601 Wayzata Blvd.
Minneapolis, MN 55305
USA
Notes:
- East View Geospatial does not refund the cost of returned packages.
- Please contact your local customs office for information about any taxes or duties that may be assessed on a return shipment.
- Returns lost in riposte shipping will not be refunded.
Data
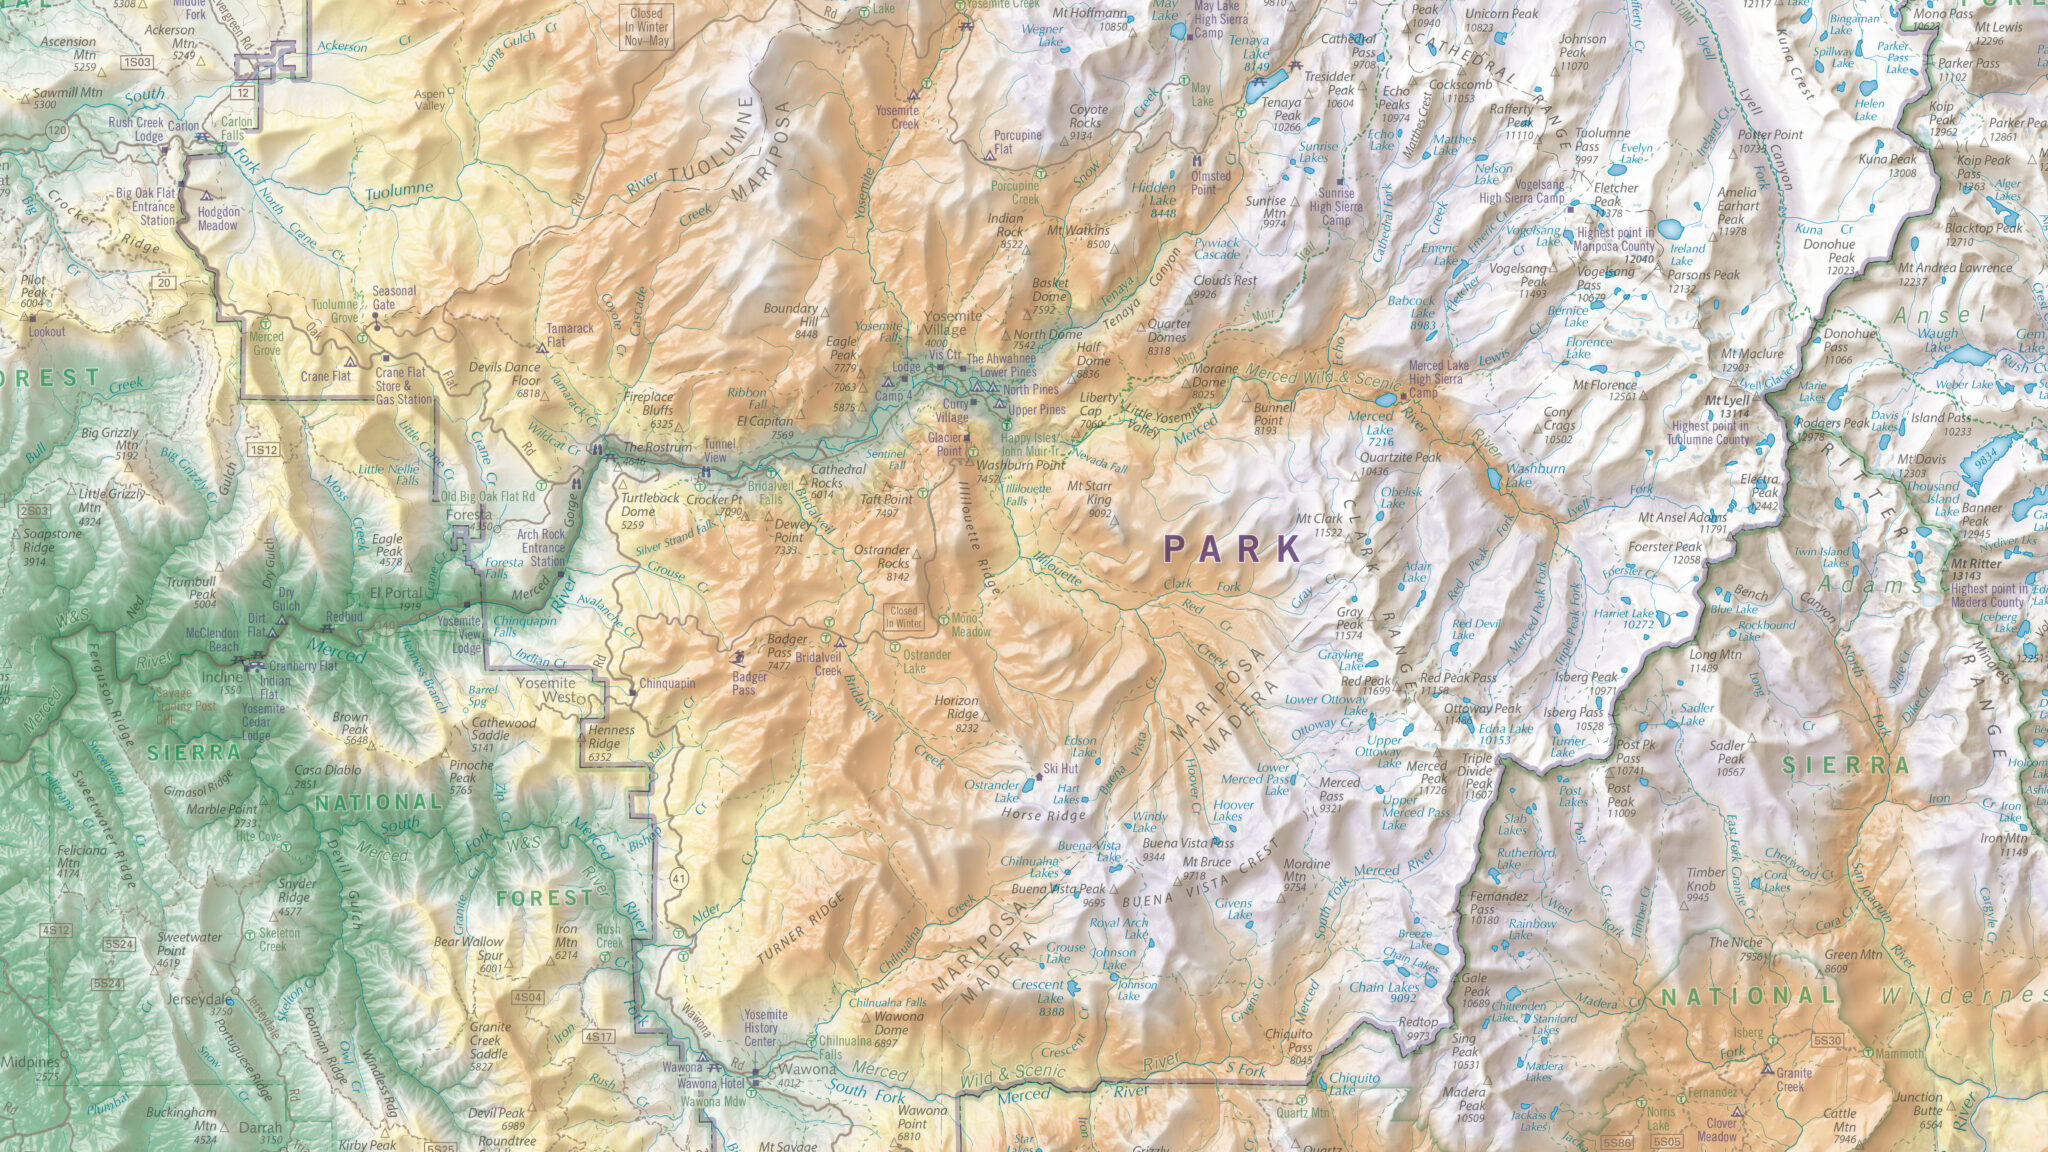
What data is available for my country of interest?
Information about available data, mapping structure, policies and programs on a country level can be reviewed on our Country Profile pages. You can also view available resources by country, alongside series and sheet level details, on Global Explorer, East View Geospatial’s online shop.
What layers are included in geospatial vector data?
Vector data can vary greatly from publication to publication, and we can only extract source data that exists on the map. A point, line or polygon feature will be used to represent existing features like points of interest, roads and lakes. Contact Us if you have questions on vector data extraction for a specific publication.
For geoscientific maps, what data comes with the map, and will it have associated explanatory notes?
We can extract data based on your needs if those features are available on the source material. Typically, the following features are focused on all geoscientific maps:
- Polygon Layer – MapUnit (code), description of geologic type and time period
- Line Layer – Geoological boundaries, faults and contacts
- Points Layer – Boreholes, mining sites, deposits, wells, minerals and strike and dip (bedding, foliation, joint)
- Data comes in a magnitude of formats including but not limited ESRI Shapefile, Mapinfo TAB, MBD, FGDB and CAD
Not all products have explanatory notes associated with them. If there are explanatory notes, they will typically be cataloged under their own map series.
How soon can I expect my download to be ready after placing an order?
Downloads are provided through a digital download link within 1-2 business days of the order.
Global ExplorerTM
What is Global Explorer and how do I use it to find what I need?
Global ExplorerTM is a free and easy way to browse our catalog. Visit our help page to get a detailed walk through of how to use Global Explorer.
What types of product formats are available through Global Explorer?
- For qualifying map series/sheets, three data data formats are available
- Paper – Receive an original or plotted copy of a map in a series. Great for collaborating in person or with a team.
- Image – Receive a georeferenced image file that can be viewed electronically across devices
- Data – Receive electonic data that can be viewed and manipulated within a specified GIS software. Great for analysis and self-interpolation.
Can I upload a shapefile (.shp) and search for products?
Yes, that feature is available in Global Explorer. You may also Contact Us if you need help finding the right data over your area of interest.
I am having trouble finding what I want, can you help me find it?
Yes! Whether it’s in our catalog or yet to be discovered, let our team help you find resources from across the world. Contact Us with your area of interest and data requirements.