Geospatial Terms Made Easy: What is GEOINT?
Geospatial data has many applications. With the continued advancement of technology, geospatial data has been used increasingly in defense and intelligence communities. This information can make or break key decision-making within the intelligence community. For example, Remote sensing technology allows for tracking activity that may have not been disclosed publicly while at great distances. We talked to East View Geospatial Sales & Marketing Director, Jonathan Thompson, about what GEOINT is and why it’s so important.
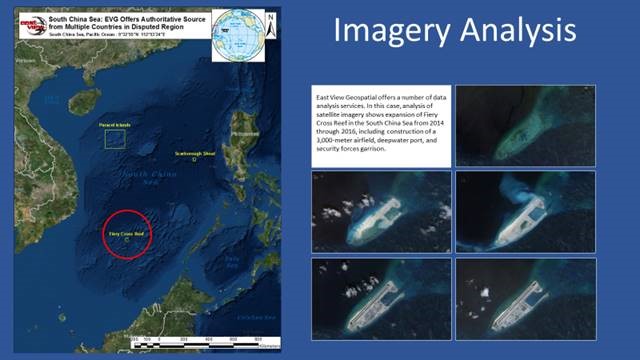
“The US Government defines GeoINT or Geospatial Intelligence, as the exploitation and analysis of imagery and geospatial information to describe, assess, and visually depict physical features and geographically referenced activities on the earth.
GEOINT is made up of three key elements: geospatial information, imagery, and imagery intelligence.
EVG regularly sources, produces, and supplies geospatial information, including topographic and scientific mapping, human geography datasets, local geonames, and transportation networks to name a few. These are key geospatial information inputs in the intelligence process.
Moreover, EVG engages in imagery intelligence and imagery interpretation. Whether it be satellite-borne, airborne, electromagnetic, radar, or synthetic, we provide and analyze all types, formats, and resolutions of remotely sensed data for imagery intelligence and analysis. “
The evolution of geospatial information has equipped defense and intelligence agencies with the ultimate decision-making tools. By utilizing readily available data and performing deep analysis & interpretation on an ever-growing amount of remotely sensed data, the intelligence community can better evaluate opportunities, and threats. As the world continues to change and countries all over the world are trying to position themselves for the best future, geospatial intelligence will be a crucial element in their long-term success.

Jonathan Thompson, Director of Sales & Marketing
The Geospatial Convergence: How Geospatial Data is Utilized to Fight Illegal Arms Trade and Enforce Embargos
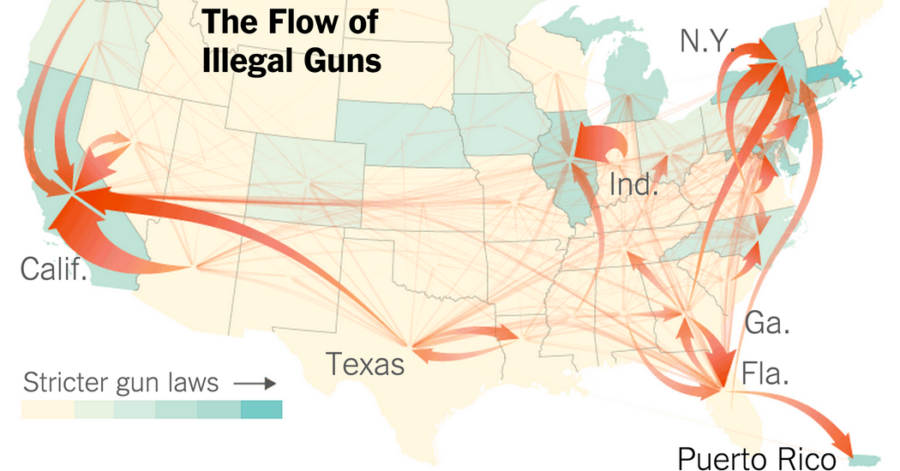
(Image courtesy of the New York Times)
If diverse datasets and geospatial information can help fine-tune global distribution networks, they can also be used to hunt them. In the fight to uphold arms embargoes around the world, the geospatial industry’s proven track record of weaving together disparate data and imagery to form a clear picture provides major assistance.
In 2018, analysis of satellite imagery was able to establish an arms embargo breach in South Sudan. In 2015, before any embargo was in place, Ukraine sold four or more Mi-24 attack helicopters to South Sudan. When an embargo went into place in July 2018, the helicopters were grounded at two different locations – a government security base in Luri and at the Juba International Airport. None were in flyable condition, and any repairs to them would violate the embargo.
Using a total of 308 satellite images, Amnesty International constructed a timeline of the helicopters’ locations since the embargo’s beginning. The analysis showed that, in October and November of 2018, the helicopters had undergone maintenance, and been moved between bases. New rotor blades were one visual clue they used to make this determination.
As discussed in our post about the geospatial industry and illegal fishing, location data from boats at sea is also helpful when searching for unlawful behavior. This applies to ships carrying embargoed weapons, too.
In March 2020, a BBC investigative report used satellite images to show that Turkey sent tanks and weapons to Libya via ship shortly after agreeing to a UN arms embargo. GIS Tracking indicated the ships left Turkey, on their way to Tunisia, but the ships’ transponders were shut off three days after its departure. Satellite images from that day showed the ships off the coast of Libya. When the ship docked at Genoa, Italy, authorities questioned the sailors, and one sailor confessed to being part of the arms trade.
Sometimes confessions of agreement-breaking are not so easy to obtain, though. Fortunately, geospatial data doesn’t lie.
Jeffrey Lewis and Melissa Hanham are experts on North Korea’s nuclear program with the East Asia Nonproliferation Program. The program is located at the Center for Nonproliferation Studies (CNS) at Middlebury’s Institute for International Studies at Monterey.
They used seismic signatures from the ground motion after five of North Korea’s nuclear tests. Combining this data with satellite imagery, they were able to build a three-dimensional map of the test site. Their ability to show the approximate dimensions of the North Korea site indicated that it was being modeled after US test tunnels. Their research utilizing geospatial data uncovered a significant amount of highly confidential information.
Key Takeaways:
- Arms embargoes are often difficult to monitor, which makes them hard to enforce. Thanks to the geospatial industry’s advances in satellite imaging and diverse data analysis, these kinds of situations can be monitored and tracked remotely.
- A creative combination of geospatial data, ship tracking records, and on-the-ground personnel can make a big difference, and stop embargo-breaking before it leads to violence.
- Satellite images can help piece together the movements of otherwise unsupervised equipment, while geospatial information can give analysts ideas about larger infrastructure, like nuclear testing sites.
The Geospatial Convergence: The Crackdown on Illegal Fishing Utilizing Geospatial Data & Technology
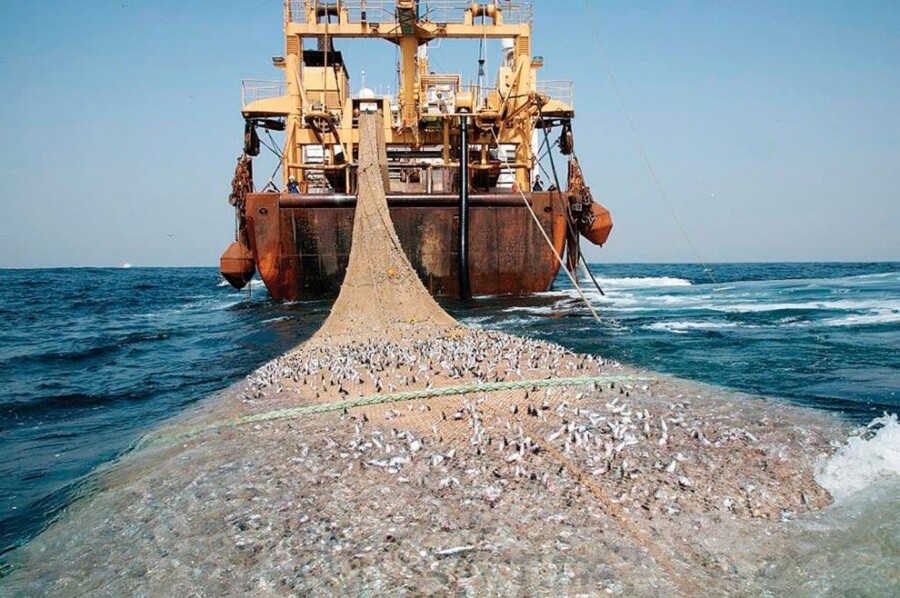
(Image courtesy of Rumbos)
The effects of illegal fishing are felt worldwide: from environments to economies. Until recently, tracking illegal fishing vessels, or even legal ones, was difficult for a number of reasons. The biggest: oceans are enormous – one ship can lose itself easily in such a vast arena. Only a fraction of their waters have ever been explored, and there are few ‘landmarks’ visible to the human eye.
That’s no longer the case, thanks to a convergence of radar, geospatial data, AIS, and data industry players.
Automatic Identification System, or AIS, was initially developed as a safety tool to track ships on their voyages. Since its initial use in the 1990s, AIS has become increasingly common, and as ships’ systems automatically check-in, that data is collected by satellite. The data grows by the day, and, over time, it can reveal patterns.

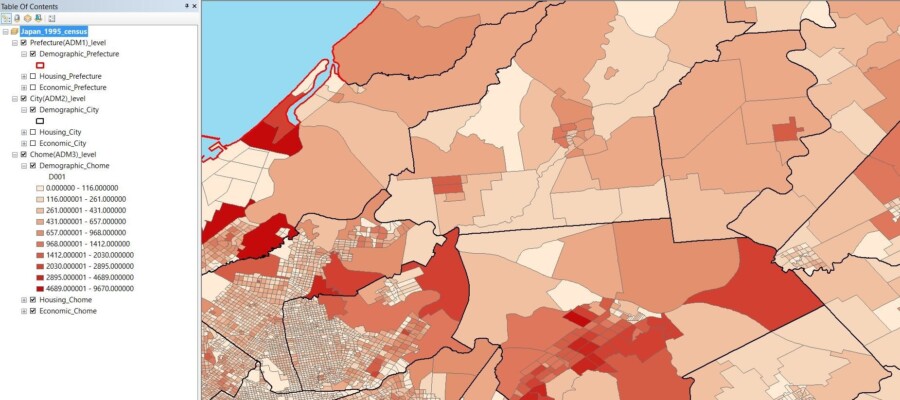
(Image Courtesy of Cult of Sea)
Ships only report an identification number and location through AIS, though. To make tracking more accurate, machine learning is being taught algorithms that can tell a commercial vessel from a yacht. To build these algorithms, human observers had to parse immense amounts of data and compile models for patterns of different kinds of vessels.
In September of 2016, SkyWatch, Oceana, and Google teamed up to analyze this immense dataset (the project began with over 3.7B data points). Their goal was to examine illegal fishing over time and provide the public access to this data, too. The initiative is called Global Fishing Watch (GFW).
The initiative is working to push back against the overfishing of 33% of the world’s major commercial fish species and to put a halt to the yearly loss of over 23 billion dollars in stolen, unreported, or unregistered seafood. Their biggest weapon: diverse datasets and geospatial information.
Today, satellites can see through clouds, which helps researchers track the movements of ships not using AIS. Trouble is, while satellite radar can see through clouds, it can’t automatically differentiate between fixed pieces of infrastructure (oil rigs, wind turbines, etc) and moving ships. Using a series of algorithms and maps, Global Fishing Watch is working to establish a database that includes fixed infrastructure, which will make ships easier to pick out of the data.
GFW can also help determine the efficacy of policies & regulations, such as bans. A recent example: their data indicated that Indonesia’s recent ban on foreign fishing vessels has resulted in an enormous drop in fishing activity there. This outcome might not be immediately recognizable based on data from fish imports or population counts. In short, geospatial data and innovative technologies like machine learning are allowing for a crackdown on illegal fishing like never before. With the help of Global Fishing Watch, the illegal fishing industry is dwindling rapidly with the hopes of completely eradicating the practice on a long term scale.
Key Takeaways:
- Illegal fishing is a problem with global implications touching everything from the environment to the economy.
- AIS was developed to keep track of ships for safety, but can now be used to detect illegal fishing patterns.
- When combined with satellite radar and data analysis, AIS data can be put into machine learning algorithms that will allow researchers, activists, and governments to act on solid information about what kinds of vessels are fishing in their waters.
Geospatial Terms Made Easy: What is Metadata?

In simple terms, Metadata is the background information about datasets (Ex: The publish year of a map is one point of metadata for that specific map). What’s the advantage of having metadata? It allows users to discover and better understand their data. We asked Vansa Kroeng, Lead GeoData Specialist at EVG, to explain metadata and why it’s important within the geospatial industry.
“Metadata is data within data. It is the description of data and is used to explain the context surrounding the data. You can use metadata to summarize any additional information about the data such as publisher, status, publish year, along with other elements. These pieces of information make data easier to find and manipulate in a database.”
How does this apply to your work at EVG?
“At EVG, I am part of the Geodata team where I work to maintain our knowledge database of global mapping and data. Our database has many different types of geographic data, and each data contains its own metadata. For example, we may receive a series of topographic maps where each individual sheet in the series has a different index, name, publish year, edition, or other piece of information. Anytime we receive data, it’s the GeoData Department’s duty to catalog all the metadata. After the metadata is cataloged, it is then entered into our database. Metadata in our database helps provide any information an EVG team member may need in order sell, advertise, or understand a specific map series or sheet. In addition, customers can leverage metadata to better understand a map or geospatial product. Metadata may provide context about when and where a geospatial dataset was produced. It can also provide additional details that are not displayed with symbology. “
Our comprehensive metadata collection is part of what sets EVG apart in the geospatial market. Details and additional information help to make products, services, and solutions more discoverable and useful, creating a better experience for our customers.

Vansa Kroeng, Lead GeoData Specialist
Geospatial Terms Made Easy: What is Cartographic Finishing?
Not only does East View Geospatial have the largest collection of maps commercially available- we create them, too! Our dedicated team of GIS and Cartographic experts utilize authoritative data to create the most accurate maps available on the market. Cartographic finishing is an essential step in the map making process. We spoke to Jason Sjolander, a GIS Technical Manager at EVG, about cartographic finishing and why it’s essential when creating print ready & digital maps.
“Cartographic finishing refers to the process by which a cartographer edits the results of automated workflows to perfect a map and ensure everything displayed on the map is accurate and up-to-date.
Many maps have automated workflows that apply different symbology (symbols representing features like rivers and roads) and annotation to a map. Current workflows deliver an accuracy around 70-90%, leaving a clear need for cartographers to evaluate, make changes and apply finishing touches. To finish the map and ensure it is 100% accurate, a cartographer must edit the symbology and/or the annotations. Moving or editing these features will add clarity and legibility to the final map product.
This final step in the cartographic process outlined above represents the bulk of cartographic work. Technology has made it so that the map making process, once long and arduous, has become almost completely automated. While these technological innovations do save time and resources, nothing can replace the eye of a cartographer.
How does this apply to your work at EVG?
Cartographic finishing is implemented every time EVG produces a map. Before any in-house map is seen by the public eye, it must go through the finishing process. Although EVG implements world-class automated cartographic workflows, there will always be a need for a cartographer to finish the map.”
Accuracy of data, symbology, annotations, and placements is crucial in today’s cartographic world. We hold ourselves to the highest quality standards and guarantee our customers that EVG cartographic products will accurately reflect the world in its current state. Contact us to find out how you can leverage geospatial data today!

Jason Sjolander
GIS Technical Manager