The Geospatial Convergence: How Geospatial Information Helps The Media Industry Illustrate What Can’t Naturally Be Seen

(Image courtesy of Esri)
If the end goal of media is to transmit big ideas and meaningful stories to readers and viewers, then geospatial data is indispensable. Whether the media is fact-based or complete fantasy, geospatial information and technology provide insights, context, and color to the data presented in a story.
In much the same way that data-rich GIS visualizations are valuable in courtrooms, their ability to relay complex info to laypeople is impactful in the media realm.
From weather patterns to following a population over time, tracking supply chains to following a viral outbreak, the news media makes use of GIS data to help break down big ideas for their viewers. Maps can give context that might lack in an old-fashioned spreadsheet infographic.
For example, election results on a spreadsheet-like table or chart might convey the winners and losers of a contest, but added context of past and present economic, social, and other data in the same voting district is where media consumers can begin to make sense of new information.
The integration has become so commonplace that the New York Times even holds “data bootcamps” to ensure its writing and editing staff have a proper handle on the technology.
A frequently-cited example of geospatial data’s importance in journalism is then-Miami Herald journalist Steve Doig’s work on the damage left behind by 1992’s Hurricane Andrew.

(Image courtesy of Risk Management Services)
He placed layers of data over one another: wind speed and damage assessment. This spacial analysis led him to determine that developers had been allowed to put up haphazard construction, leaving properties vulnerable to hurricanes. This insight not only put blame on the relaxed regulations in place, but it also allowed for future preparation for storms in the area.
Other corners of the media industry use GIS data to simulate multi-layered destruction, in an effort to bring fictional stories as close to real-life as possible. Geospatial information helps embellish imagined worlds on TV and movie screens in a similar fashion to how it does in video games.
For the havoc created by extraterrestrial visitors to Earth in 2016’s Independence Day: Resurgence, Esri’s CityEngine was used to create lifelike renderings of real cities like Singapore to be annihilated. Nine months of work went into roughly forty seconds of footage, but that work can now be built upon (even if it was wiped out in a simulation run for the movie).

(Image courtesy of geoinformatics.com)
For the future-ruins of Las Vegas in BladeRunner 2049, the movie’s visual effects team, Framestore, turned to CityEngine. They based the foundations of their version of Las Vegas on government maps, then continued to embellish it with other data. The effect is a startlingly real-seeming expanse of waste and degraded architecture that feels close enough to the real city to be jarring. That might explain why Framestore was awarded an Academy Award for their work on BladeRunner 2049.
In short, geospatial data continues to play an important role within television, journalism and movies to illustrate data, draw insights and create real-life landscapes. Given the constant innovation within this field, it will be fascinating to observe how GIS and cartography will be integrated within the Media industry as technology evolves.
Key Takeaways:
- GIS data helps the media industry pass on stories and information to consumers in more easy-to-digest formats than charts, spreadsheets, and paragraphs.
- In journalism, the ability to layer data points out previously hidden societal dynamics, and the ability to render findings into map form helps readers and viewers digest the information quicker.
- Movies have begun using technology like Ersi’s CityEngine to create lifelike renderings of cities (both real and imagined) with reality-based detailing, thus heightening audience immersion.
The Geospatial Convergence: The Case-Closing Impacts of Geospatial Data on Litigation
(Image courtesy of Point of Beginning)
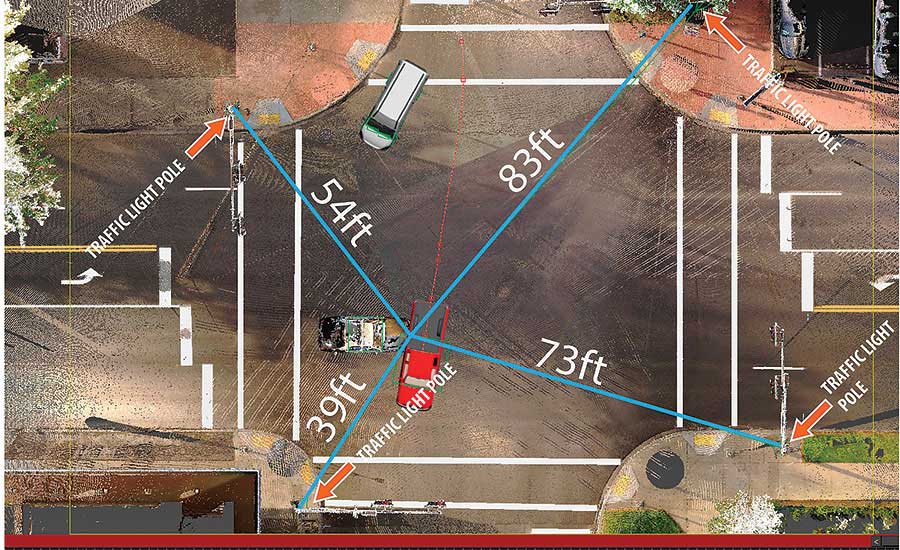
In litigation, a clear explanation of a complex situation can win the case. Though printed spreadsheets, maps, and reports are effective, assembling their disparate facts into a convincing narrative can take up valuable time and resources. Today’s digital GIS capabilities accelerate both analysis and data acquisition, while also improving accuracy.
Recreation & Simulation
Recreation and simulation are two of the most convincing ways geospatial data can be used in a courtroom. This is true across the spectrum of litigious issues: from vehicle accidents and personal injuries to medical malpractice and product liability, a litigator’s ability to be clear and accurate is essential.
Site data, orthographic images (aerial images made to reflect actual scale), and topography can be combined to render a realistic depiction of events described by witnesses. By giving decision-makers a visual model of events, litigators help them make more accurate decisions. The interactive nature of these models allows for the court to see an incident from other perspectives, too.
Virtual simulations of events are fashioned out of much of the same information; site data is gathered, then run through a computer-assisted simulation. This is less common, and subject to more stringent vetting to be used as evidence, but is helpful nonetheless. It can be especially useful in lawsuits that involve uncommon activities like repelling or snowboarding, as a tool to reconstruct and animate a sequence of events that may otherwise confuse judges and juries.
Boundary Disputes
In boundary disputes, the value of geospatial data is hard to overstate. Drone mapping has increased accuracy in litigation around these kinds of issues, and not just for big companies or governments.
Organizations like Earthjustice utilize GIS data to aid those in need of advocacy. In 2018, the Pawnee Nation and Earthjustice proved that seventeen oil and gas leases had been illegally approved by the US Government on Pawnee lands. To date, the US Government walked back approval of all but four of those leases.

(Oil tracking image courtesy of Earthjustice)
In Montana, Earthjustice was able to help residents prove that the Bureau of Land Management’s issuance of 287 oil and gas leases did not consider risks to the state’s water and environment. A federal judge reversed the approval. Without access to compelling data, this might not have been possible.
Earthjustice also uses GIS to give the public ways to visualize issues. Their ‘Fraccidents’ map displays all the accidents related to the practice across the country, and, to illustrate the scale of a proposed fracking project, transposed it onto New York City.

(‘Fraccidents’ map courtesy of Earthjustice)
Some of the data and tools used by organizations come from private initiatives, like Esri’s Conservation Program, which connected environmental activists to geospatial resources from 1989 to 2019. The program provided software, training, databases, and connection to experts.
Today, the initiative’s work continues at https://community.esri.com/groups/conservation-gis. There, the work and findings of previous grantees have been compiled in the Conservation GIS Reference Project.
Key Takeaways:
- In litigation, geospatial information is primarily used for either event recreation or data collection.
- The ability to reconstruct or simulate events adds depth and clarity to witness testimony and allows for other perspectives of an incident to be viewed.
- The increasingly widespread availability of GIS data has shortened the technological-capability gap between big entities like governments or companies and smaller ones like Earthjustice or the Pawnee Nation.
The Geospatial Convergence: How Geospatial Data is Utilized to Fight Illegal Arms Trade and Enforce Embargos
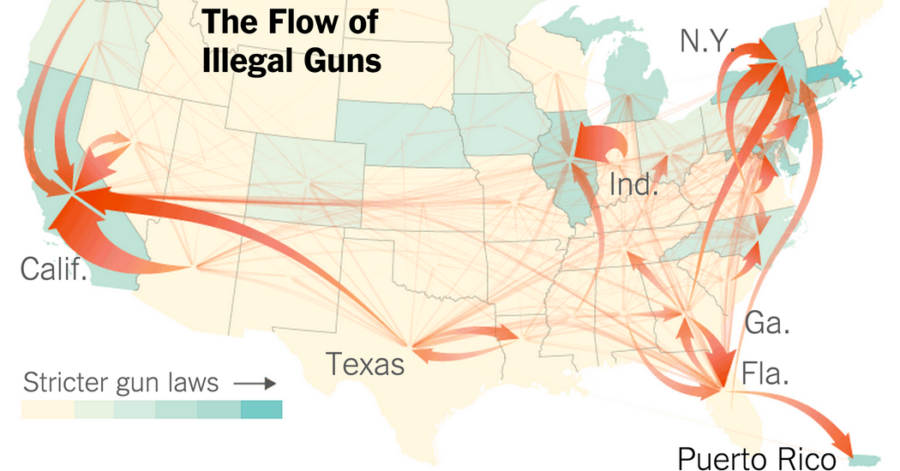
(Image courtesy of the New York Times)
If diverse datasets and geospatial information can help fine-tune global distribution networks, they can also be used to hunt them. In the fight to uphold arms embargoes around the world, the geospatial industry’s proven track record of weaving together disparate data and imagery to form a clear picture provides major assistance.
In 2018, analysis of satellite imagery was able to establish an arms embargo breach in South Sudan. In 2015, before any embargo was in place, Ukraine sold four or more Mi-24 attack helicopters to South Sudan. When an embargo went into place in July 2018, the helicopters were grounded at two different locations – a government security base in Luri and at the Juba International Airport. None were in flyable condition, and any repairs to them would violate the embargo.
Using a total of 308 satellite images, Amnesty International constructed a timeline of the helicopters’ locations since the embargo’s beginning. The analysis showed that, in October and November of 2018, the helicopters had undergone maintenance, and been moved between bases. New rotor blades were one visual clue they used to make this determination.
As discussed in our post about the geospatial industry and illegal fishing, location data from boats at sea is also helpful when searching for unlawful behavior. This applies to ships carrying embargoed weapons, too.
In March 2020, a BBC investigative report used satellite images to show that Turkey sent tanks and weapons to Libya via ship shortly after agreeing to a UN arms embargo. GIS Tracking indicated the ships left Turkey, on their way to Tunisia, but the ships’ transponders were shut off three days after its departure. Satellite images from that day showed the ships off the coast of Libya. When the ship docked at Genoa, Italy, authorities questioned the sailors, and one sailor confessed to being part of the arms trade.
Sometimes confessions of agreement-breaking are not so easy to obtain, though. Fortunately, geospatial data doesn’t lie.
Jeffrey Lewis and Melissa Hanham are experts on North Korea’s nuclear program with the East Asia Nonproliferation Program. The program is located at the Center for Nonproliferation Studies (CNS) at Middlebury’s Institute for International Studies at Monterey.
They used seismic signatures from the ground motion after five of North Korea’s nuclear tests. Combining this data with satellite imagery, they were able to build a three-dimensional map of the test site. Their ability to show the approximate dimensions of the North Korea site indicated that it was being modeled after US test tunnels. Their research utilizing geospatial data uncovered a significant amount of highly confidential information.
Key Takeaways:
- Arms embargoes are often difficult to monitor, which makes them hard to enforce. Thanks to the geospatial industry’s advances in satellite imaging and diverse data analysis, these kinds of situations can be monitored and tracked remotely.
- A creative combination of geospatial data, ship tracking records, and on-the-ground personnel can make a big difference, and stop embargo-breaking before it leads to violence.
- Satellite images can help piece together the movements of otherwise unsupervised equipment, while geospatial information can give analysts ideas about larger infrastructure, like nuclear testing sites.
The Geospatial Convergence: The Crackdown on Illegal Fishing Utilizing Geospatial Data & Technology
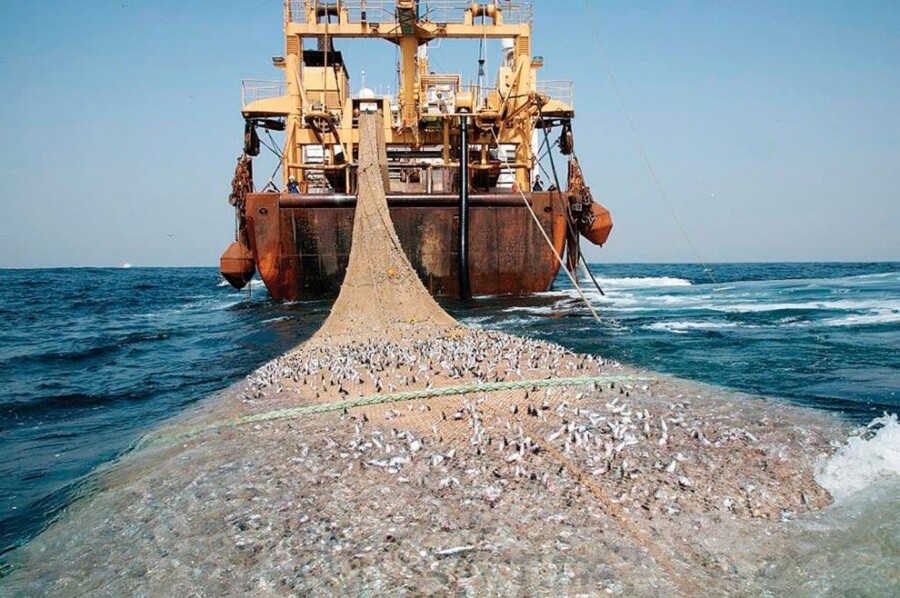
(Image courtesy of Rumbos)
The effects of illegal fishing are felt worldwide: from environments to economies. Until recently, tracking illegal fishing vessels, or even legal ones, was difficult for a number of reasons. The biggest: oceans are enormous – one ship can lose itself easily in such a vast arena. Only a fraction of their waters have ever been explored, and there are few ‘landmarks’ visible to the human eye.
That’s no longer the case, thanks to a convergence of radar, geospatial data, AIS, and data industry players.
Automatic Identification System, or AIS, was initially developed as a safety tool to track ships on their voyages. Since its initial use in the 1990s, AIS has become increasingly common, and as ships’ systems automatically check-in, that data is collected by satellite. The data grows by the day, and, over time, it can reveal patterns.

(Image Courtesy of Cult of Sea)
Ships only report an identification number and location through AIS, though. To make tracking more accurate, machine learning is being taught algorithms that can tell a commercial vessel from a yacht. To build these algorithms, human observers had to parse immense amounts of data and compile models for patterns of different kinds of vessels.
In September of 2016, SkyWatch, Oceana, and Google teamed up to analyze this immense dataset (the project began with over 3.7B data points). Their goal was to examine illegal fishing over time and provide the public access to this data, too. The initiative is called Global Fishing Watch (GFW).
The initiative is working to push back against the overfishing of 33% of the world’s major commercial fish species and to put a halt to the yearly loss of over 23 billion dollars in stolen, unreported, or unregistered seafood. Their biggest weapon: diverse datasets and geospatial information.
Today, satellites can see through clouds, which helps researchers track the movements of ships not using AIS. Trouble is, while satellite radar can see through clouds, it can’t automatically differentiate between fixed pieces of infrastructure (oil rigs, wind turbines, etc) and moving ships. Using a series of algorithms and maps, Global Fishing Watch is working to establish a database that includes fixed infrastructure, which will make ships easier to pick out of the data.
GFW can also help determine the efficacy of policies & regulations, such as bans. A recent example: their data indicated that Indonesia’s recent ban on foreign fishing vessels has resulted in an enormous drop in fishing activity there. This outcome might not be immediately recognizable based on data from fish imports or population counts. In short, geospatial data and innovative technologies like machine learning are allowing for a crackdown on illegal fishing like never before. With the help of Global Fishing Watch, the illegal fishing industry is dwindling rapidly with the hopes of completely eradicating the practice on a long term scale.
Key Takeaways:
- Illegal fishing is a problem with global implications touching everything from the environment to the economy.
- AIS was developed to keep track of ships for safety, but can now be used to detect illegal fishing patterns.
- When combined with satellite radar and data analysis, AIS data can be put into machine learning algorithms that will allow researchers, activists, and governments to act on solid information about what kinds of vessels are fishing in their waters.
The Geospatial Convergence: How GIS and Remote Sensing Technology Revolutionized the Study and Practice of Archaeology
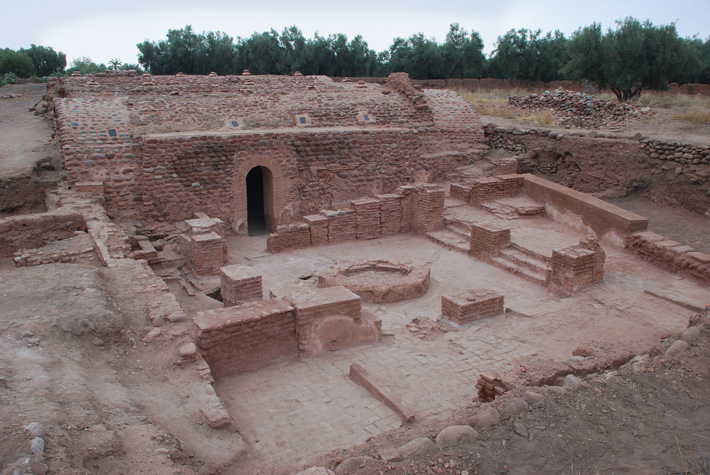
(Image courtesy of archaeology.org)
Since their initial convergence in the 1980s, the advent of remote sensing has revolutionized the way today’s humans learn about those from the past by allowing modern archaeologists to find signs of ancient civilizations where others could not.
Thanks to satellite imagery, on-the-ground LiDAR technology, and GIS, ‘remote sensing,’ or exploring a site without excavating it, has become standard practice in archaeology. The ability to examine areas that are not geographically close to researchers optimizes the process and makes exploration more efficient.
Some remote sensing can be done from the ground via Ground Penetrating Radar (a radar device dragged over a site to provide rough structural images) or Geophysical Diffraction Tomography (which shoots soundwaves into the ground from a shotgun), but much is done from above.
Aerial views in the early 1900s of places like Stonehenge were precursors for today’s marriage of geospatial imaging and archaeology. The relationship was cemented in 1981, when NASA’s SIR-A imaging system was launched, using reflected sunlight to create images. When it was flown over an archaeological site in the Sahara Desert, the driest place on the planet, SIR-A sent back underground images of a landscape that had once been the site of many lakes and rivers. The riverbanks revealed by that flyover proved rich in prehistoric tools and other artifacts.
Seeing things from above is one thing, but seeing them in infrared and other wavelengths not visible to the human eye is another. Infrared imaging technology is the second way geospatial information has proved invaluable to uncovering humanity’s past.

The satellite image on the left shows only visible sand dunes, while Spaceborne Imaging Radar, also known as SIR, was able to detect an ancient river bed beneath the sand dunes. Image courtesy of NASA.
Buried structures affect how things grow over them, and infrared imaging can help detect these clues. Heat emission varies for materials like rock, sand, flora, and cultivated soil. Human enterprises, like farming or construction, change the heat signature of the land. Observed temperature variations in the soil can reveal texture differences, which, in turn, can point to the potential of past farm fields. Rock, for example, absorbs more heat than soil, so hotter temperatures in soil may point to buried stone structures. Archaeologists were able to find the Maya causeway (early types of human-made roads) because its infrared radiation was observed at different wavelengths than the plant growth around it.
Computers programmed to seek out these outlying heat signatures allow for a much larger swath of land to be surveyed, while LiDAR gives archaeologists a fantastic tool for finding evidence of human activity once sites are identified. Archaeologists can now reliably detect everything from anomalous forest structures to underwater shipwrecks without ever breaking ground or donning a wetsuit. This is especially helpful in urban environments, where modern civilization has grown over the old and won’t allow for excavation.
Finally, large-scale databases help organize and analyze historic sites from around the world, leading to new insights from old finds. Patterns and predictive models can be made from the resulting analysis and used to further research human history. To pinpoint a new potential site, factors like proximity to water, other cities, or even information from old paper maps are all considered.
Key Takeaways:
- The relationship between GIS and archaeology goes back to the early 1900s.
- advances in GIS data have helped archeologists survey land for sites, using infrared imaging and LiDAR to find anomalous forest structures.
- The diverse datasets provided give new insights to ‘old’ discoveries and the data needed to create predictive modeling for focused searches.