Geospatial Terms Made Easy: What is Cartographic Finishing?
Not only does East View Geospatial have the largest collection of maps commercially available- we create them, too! Our dedicated team of GIS and Cartographic experts utilize authoritative data to create the most accurate maps available on the market. Cartographic finishing is an essential step in the map making process. We spoke to Jason Sjolander, a GIS Technical Manager at EVG, about cartographic finishing and why it’s essential when creating print ready & digital maps.
“Cartographic finishing refers to the process by which a cartographer edits the results of automated workflows to perfect a map and ensure everything displayed on the map is accurate and up-to-date.
Many maps have automated workflows that apply different symbology (symbols representing features like rivers and roads) and annotation to a map. Current workflows deliver an accuracy around 70-90%, leaving a clear need for cartographers to evaluate, make changes and apply finishing touches. To finish the map and ensure it is 100% accurate, a cartographer must edit the symbology and/or the annotations. Moving or editing these features will add clarity and legibility to the final map product.
This final step in the cartographic process outlined above represents the bulk of cartographic work. Technology has made it so that the map making process, once long and arduous, has become almost completely automated. While these technological innovations do save time and resources, nothing can replace the eye of a cartographer.
How does this apply to your work at EVG?
Cartographic finishing is implemented every time EVG produces a map. Before any in-house map is seen by the public eye, it must go through the finishing process. Although EVG implements world-class automated cartographic workflows, there will always be a need for a cartographer to finish the map.”
Accuracy of data, symbology, annotations, and placements is crucial in today’s cartographic world. We hold ourselves to the highest quality standards and guarantee our customers that EVG cartographic products will accurately reflect the world in its current state. Contact us to find out how you can leverage geospatial data today!

Jason Sjolander
GIS Technical Manager
Geospatial Terms Made Easy: What Are Map Features and Layers?
Features and Layers are the basis of all modern maps. Adding them is the first step in the cartographic process, and with the right data, they can help to visualize elements that have never been seen. We asked Elliot Young, a Global Census Archive Analyst at EVG, to go into detail about what map features and layers are as well as their importance.

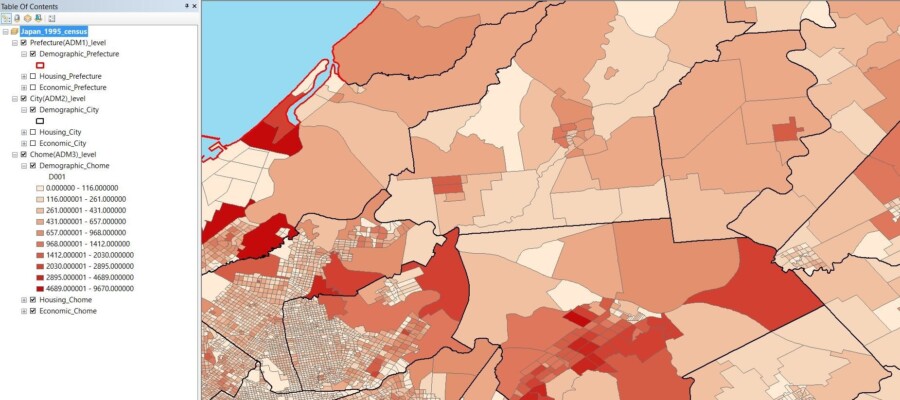
“Map features/layers are how GIS programs organize the grouping of vector and raster data used to visualize data on a map or screen. These are the features that are often shown in a Table of Contents or legend and often have options for editing and visualization. These layers can range from something as simple as roads to something as complex as a feature that represents a geographic area where a certain language is spoken. Certain features can be toggled on or off to show exactly what data you want to display at any given time. Layers are one of the most elemental features of maps, but some of the most important. Without the right layers, you won’t be able make the map, as layers are essential to visualizing the data you wish convey.
When crafting one of EVG’s many Census products, we are often combining data that is normally seen in tables or spreadsheets. With map features and layers, we can show multiple population and housing variables by organizing, combining, and visualizing to show correlations and relationships that are hard to conceptualize when not being viewed spatially. This transformation from spreadsheet data to visualized data can help researchers and professionals see patterns and trends they may not have been able to see previously. This is just one example of why having the correct map features and layers is so important. “
We work tirelessly to ensure we provide the most accurate data, cartographic products, and custom solutions for our clients. We offer a wide variety of off-the-shelf products and we are more than happy to work with you to get the exact geospatial solution you need. Contact us to find out more.

Elliot Young, Global Census Archive Analyst
Geospatial Terms Made Easy: What is a Digital Elevation Model?
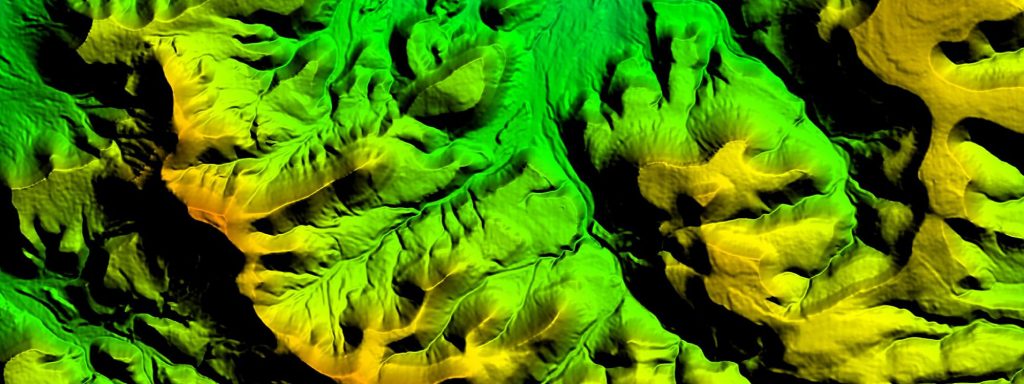
(This is an example of a Digital Elevation Model, made in-house at East View Geospatial.)
At East View Geospatial, much of the work we do is project-based and involves helping our clients better understand the physical terrains of their areas of interest (AOIs).
Digital Elevation Models, or DEMs, are frequently vital data inputs in that process. We asked our Senior Account Manager, Jerod Fink, to break down what DEMs are and to go over how we utilize them here at EVG.
“A Digital Elevation Model (or DEM) is a 3D representation of a terrain surface. DEM data is displayed as a grid, usually represented in meters. This data utilizes an elevation or Z value at the center point of the grid cell to indicate height above or below sea level (in bathymetry data), or an ellipsoid. Grid cells can vary from 1km square to less than a meter square. The lower the grid spacing, the higher resolution, and thus more accurate and detailed a dataset becomes. High-resolution DEMs have many uses across all different industries, especially for different types of planning.
DEM is an overarching term for elevation data which can be further defined into two types: Digital Terrain Models (DTM) and Digital Surface Models (DSM). DTM heights represent bare-earth terrain. With corrected hydrographic features, rivers flow downhill, and the user can get a very accurate representation of all-natural terrain features.
Digital Surface Models (DSM) incorporate the built-up environment above the terrain in their values. For example, buildings, bridges, tree canopy and other vegetation heights.
DSMs are used widely in pipeline planning, mobile network development, and population movement studies. DSMs are of particular use to the airline industry (both civilian and military) for obstacles and terrain avoidance systems.
DTMs, on the other hand, are used widely in the planning of smaller areas where terrain details are of utmost importance. A few of the specific areas where DTMs are widely used are road development, ski resort construction, oil and gas pad construction/maintenance, and particularly flood mitigation.
Accuracy in planning is key- businesses need extremely detailed and specific data to ensure that time and resources are utilized in the most efficient way.”
At EVG, we provide both off-the-shelf elevation data as well as produce custom elevation models in-house so they can be tailored to our clients’ exact specifications. We are your GeoConsultant and will work with you to find the right product or solution to meets your needs. Contact us to see how we can work with you today!