Though impressive, the large dry-erase map housed at Eco-Challenge Fiji headquarters lacked something crucial – the ability to track the progress of competitors in real time. This led to our final contribution: data for a digital tracking web app.
Had the show focused on teams racing through major highways in the United States, the production team may have been able to utilize existing services like Google Maps, Waze, or any number of open-source applications. The Eco-Challenge production team selected the competition territory because of its remote nature, though, and its mélange of river rapids, thick jungle, swampland, and ocean tides rendered any online web-based live-tracking application out of the question. The solution: a custom built, offline functioning, real-time digital tracking application, intended to be displayed on a large touchscreen located in production HQ. Each team was given a GPS transmitter that sent their signal to the HQ every 15 minutes, allowing for near-real time tracking. Not only was their location information available, producers could also monitor information such as average speed, total time and total distance since the last GPS pin drop.
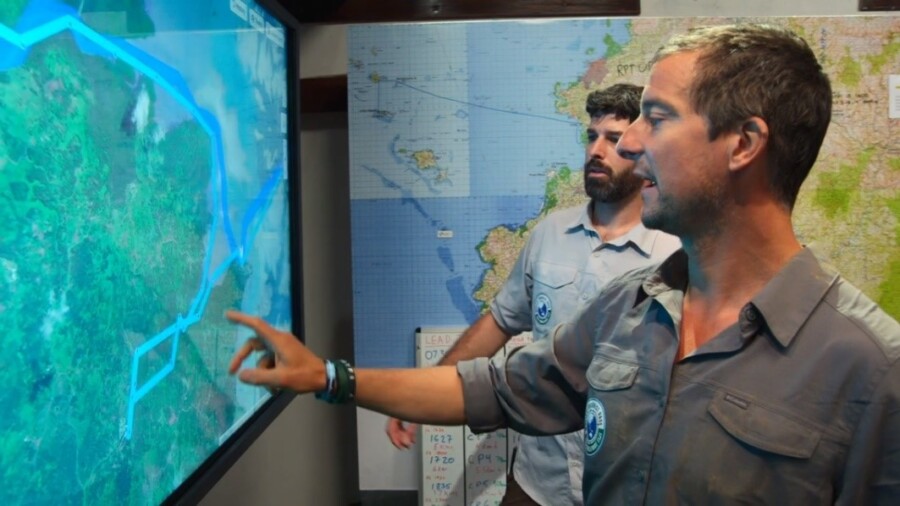
Bear Grylls and Race Operations Coordinator, Philippe Gautier, examine team positions on the web app. Image courtesy of Amazon.
Our first step was to reformat the previously generated custom maps into basemap layers optimized for web application functionality and display.
In addition to the 50K and 250K topographic and nautical chart basemap layers, we also prepared and delivered tile packages of satellite imagery and digital elevation data for integration into the web application.
With each dataset treated as a separate layer, users could choose which map they wanted to have displayed in the background, whether that be large scale topographic mapping (similar to what the competitors were using) or satellite imagery.
Moreover, the imagery was prepared in such a way that allowed for two separate satellite imagery datasets to be combined into a single tileset for efficient display: low resolution imagery is employed at higher zoom levels, while the high-resolution images allow course details to stand out when Grylls’s hand hits the touchscreen to zoom in on team activity.
Finally, the digital elevation model (DEM) was integrated behind the scenes to enable terrain profiles and 3D rendering of the course with the imagery or other layers draped on top.
Our work with Eco-Challenge is a reminder that the use of geospatial data is as varied as its applications. The unique challenge of supplying data for a tracking app using maps created and printed by our team to monitor competitors who are competing, overcoming, and, ‘occasionally,’ suffering on a route our sourcing abilities helped select, is not lost on us. We are incredibly proud to have been able to offer our services and expertise on such an exciting event.
To stream the incredible work of the MGM Studios production team and the competitors they chronicle, head over to: https://www.amazon.com/Worlds-Toughest-Race-Eco-Challenge-Fiji-Season/dp/B08BB8S8FJ, and https://ecochallenge.com to see more behind-the-scenes content.