Synthetic Aperture Radar, or SAR, sees through things that neither the human eye nor electro-optical methods could ever hope to.
Seasat, the first satellite bearing SAR, departed Earth from the Vandenberg Space Launch Complex in California on June 28, 1978. In the decades since, constellations of SAR satellites have been launched and now orbit the planet, taking in data with uses ranging from measuring tiny daily changes in oceans to monitoring economic infrastructure use and aiding disaster relief efforts.
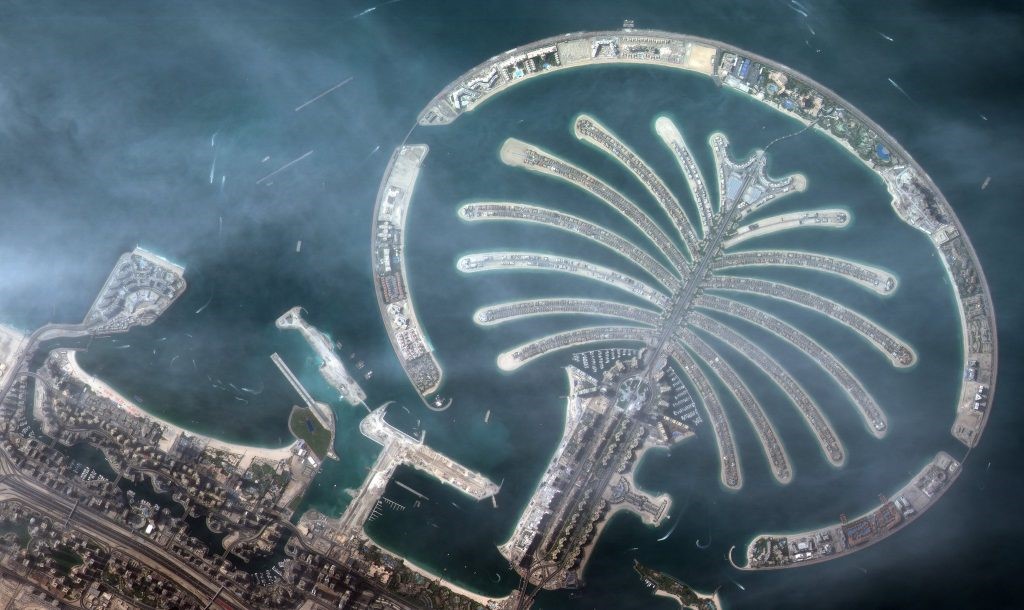
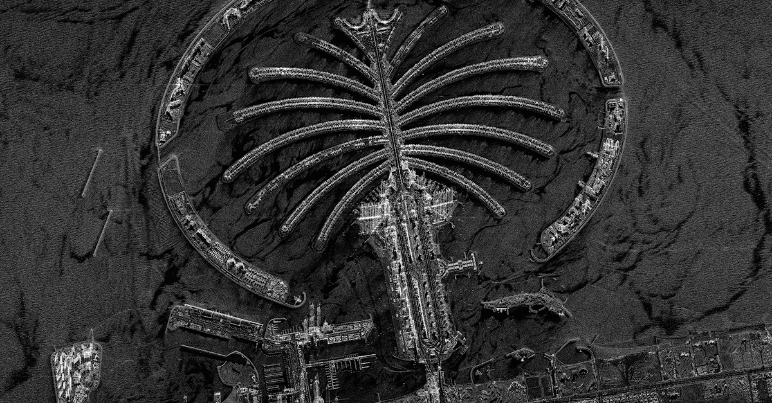
A satellite image compared to a SAR image. Images courtesy of the Dubai Media Office (left) and Capella Space (right).
Like infrared, SAR can penetrate below old barriers like soil, ice, and vegetation. The difference becomes apparent when weather (or worse) rolls in. Traditional electro-optical sensors are rendered blind by clouds, smoke, and at night. SAR sensors are not. They can perform overhead collections in all weather and illumination conditions. A change map that updates as fires rage is a powerful tool against increasingly destructive wildfires in the western United States; the same could be said for oil spills in storms or flooded cities with ongoing rain.
SAR is able to penetrate these things because they are active sensors. The pulses they emit ‘illuminate’ the ground or other surfaces using microwaves. Optical sensors, by contrast, are passive, and rely on sunlight reflecting back from the earth’s surface, which can be blocked by clouds, etc.
SAR satellites emit their own electronic apertures. These apertures send out pulses and measure the phase, intensity, and time it takes for the signal to return after bouncing off a surface (see diagram to the left, courtesy of Centre for Remote Imaging, Sensing & Processing). Though phase does not resemble traditional imaging data, it collects displacement and height data (another capability optical sensors do not have) and this is useful for interferometry and polarimetry.
SAR shows visual characteristics based on backscatter, which detects change and surface texture. There are three kinds of backscatter; each tells its own story.
Diffuse, or rough, backscatter, indicates mountains or other terrain. Specular reflections occur when a pulse bounces off of a smooth surface, like water or pavement. These regions appear dark in visualizations. Double bounce backscatter is prevalent in urban environments; it occurs when a specular reflection is interrupted by a building or other structure on its way back to the satellite. This results in bright pixels.
SAR instruments use a wide range of band frequencies which determine how the data can be used. Longer wavelengths/lower frequency SAR signals can ‘see’ through matter like vegetation and soil, for example. The frequencies also determine what size features SAR data picks up on. The size of the wave correlates to the size of the object it is supposed to sense; high-frequency bands ‘see’ details like leaves on a tree, while lower frequencies ‘see’ that same tree’s trunk.
The result is a wide range of available scales – from 0.5 meter to 200 km. As a wealth of SAR satellites now inhabit our skies, more and more data is available for free, though much also remains private. This data can be processed in an array of software, from open source tools to standard commercial software like ArcGIS, Gamma, ENVI, and others.
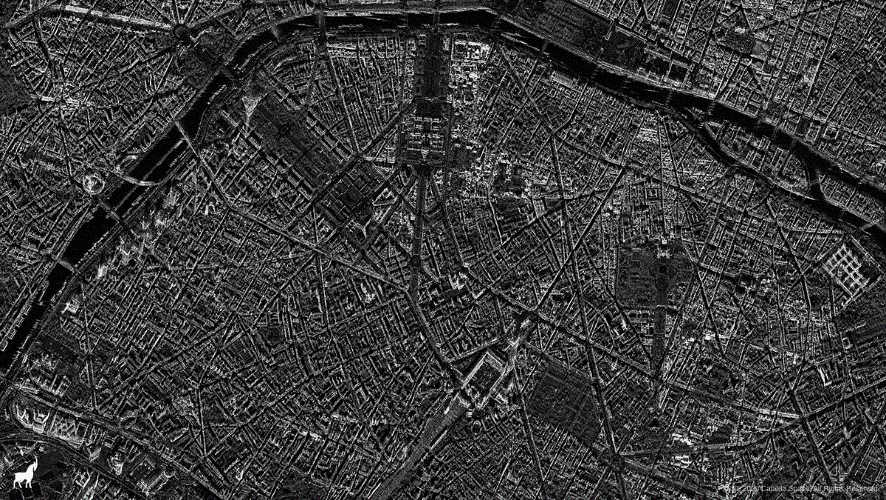
A SAR image of Paris. Image courtesy of Capella Space.
SAR and EO data can also be combined, as the recent SpaceNet6 challenge proved. The contest offered $50,000 in cash prizes to the competitors best able to fuse SAR data with electro-optical imagery courtesy of the Maxar WorldView-2 satellite. The goal of the challenge was to create an image of Rotterdam, The Netherlands. The winners of that challenge (who can be found here) are now among a growing number of people putting the power of SAR front and center in the geospatial world.