The Critical Role of Spatial Data in COVID-19 Vaccination
Key Takeaways
- In COVID-19 vaccination efforts, leveraging spatial information is essential in planning, distribution and post-vaccination tracking
- In the planning phase, spatial data helps identify vaccine distribution sites and priority populations
- Following vaccination, spatial information can be used to track how many people have received doses and predict when populations will reach herd immunity
- GIS can be used to boost the transparency of vaccination efforts to promote greater public trust
In the battle against COVID-19, developing a vaccine was one step toward victory. Now the world needs logistics experts to distribute the vaccines accurately, equitably, and quickly. Location-based data analysis has proven to be an essential tool for these experts.
The Centers for Disease Control (CDC) and miscellaneous health groups have been using spatial data since the onset of the pandemic. In a recent article on GovConWire, chief of commercial mission integration at the US’ National Geospatial-Intelligence Agency (NGA) Juan Sainz noted that geospatial data usage increased by over 100% and there was an influx of new users since COVID-19’s arrival in the winter of 2020.
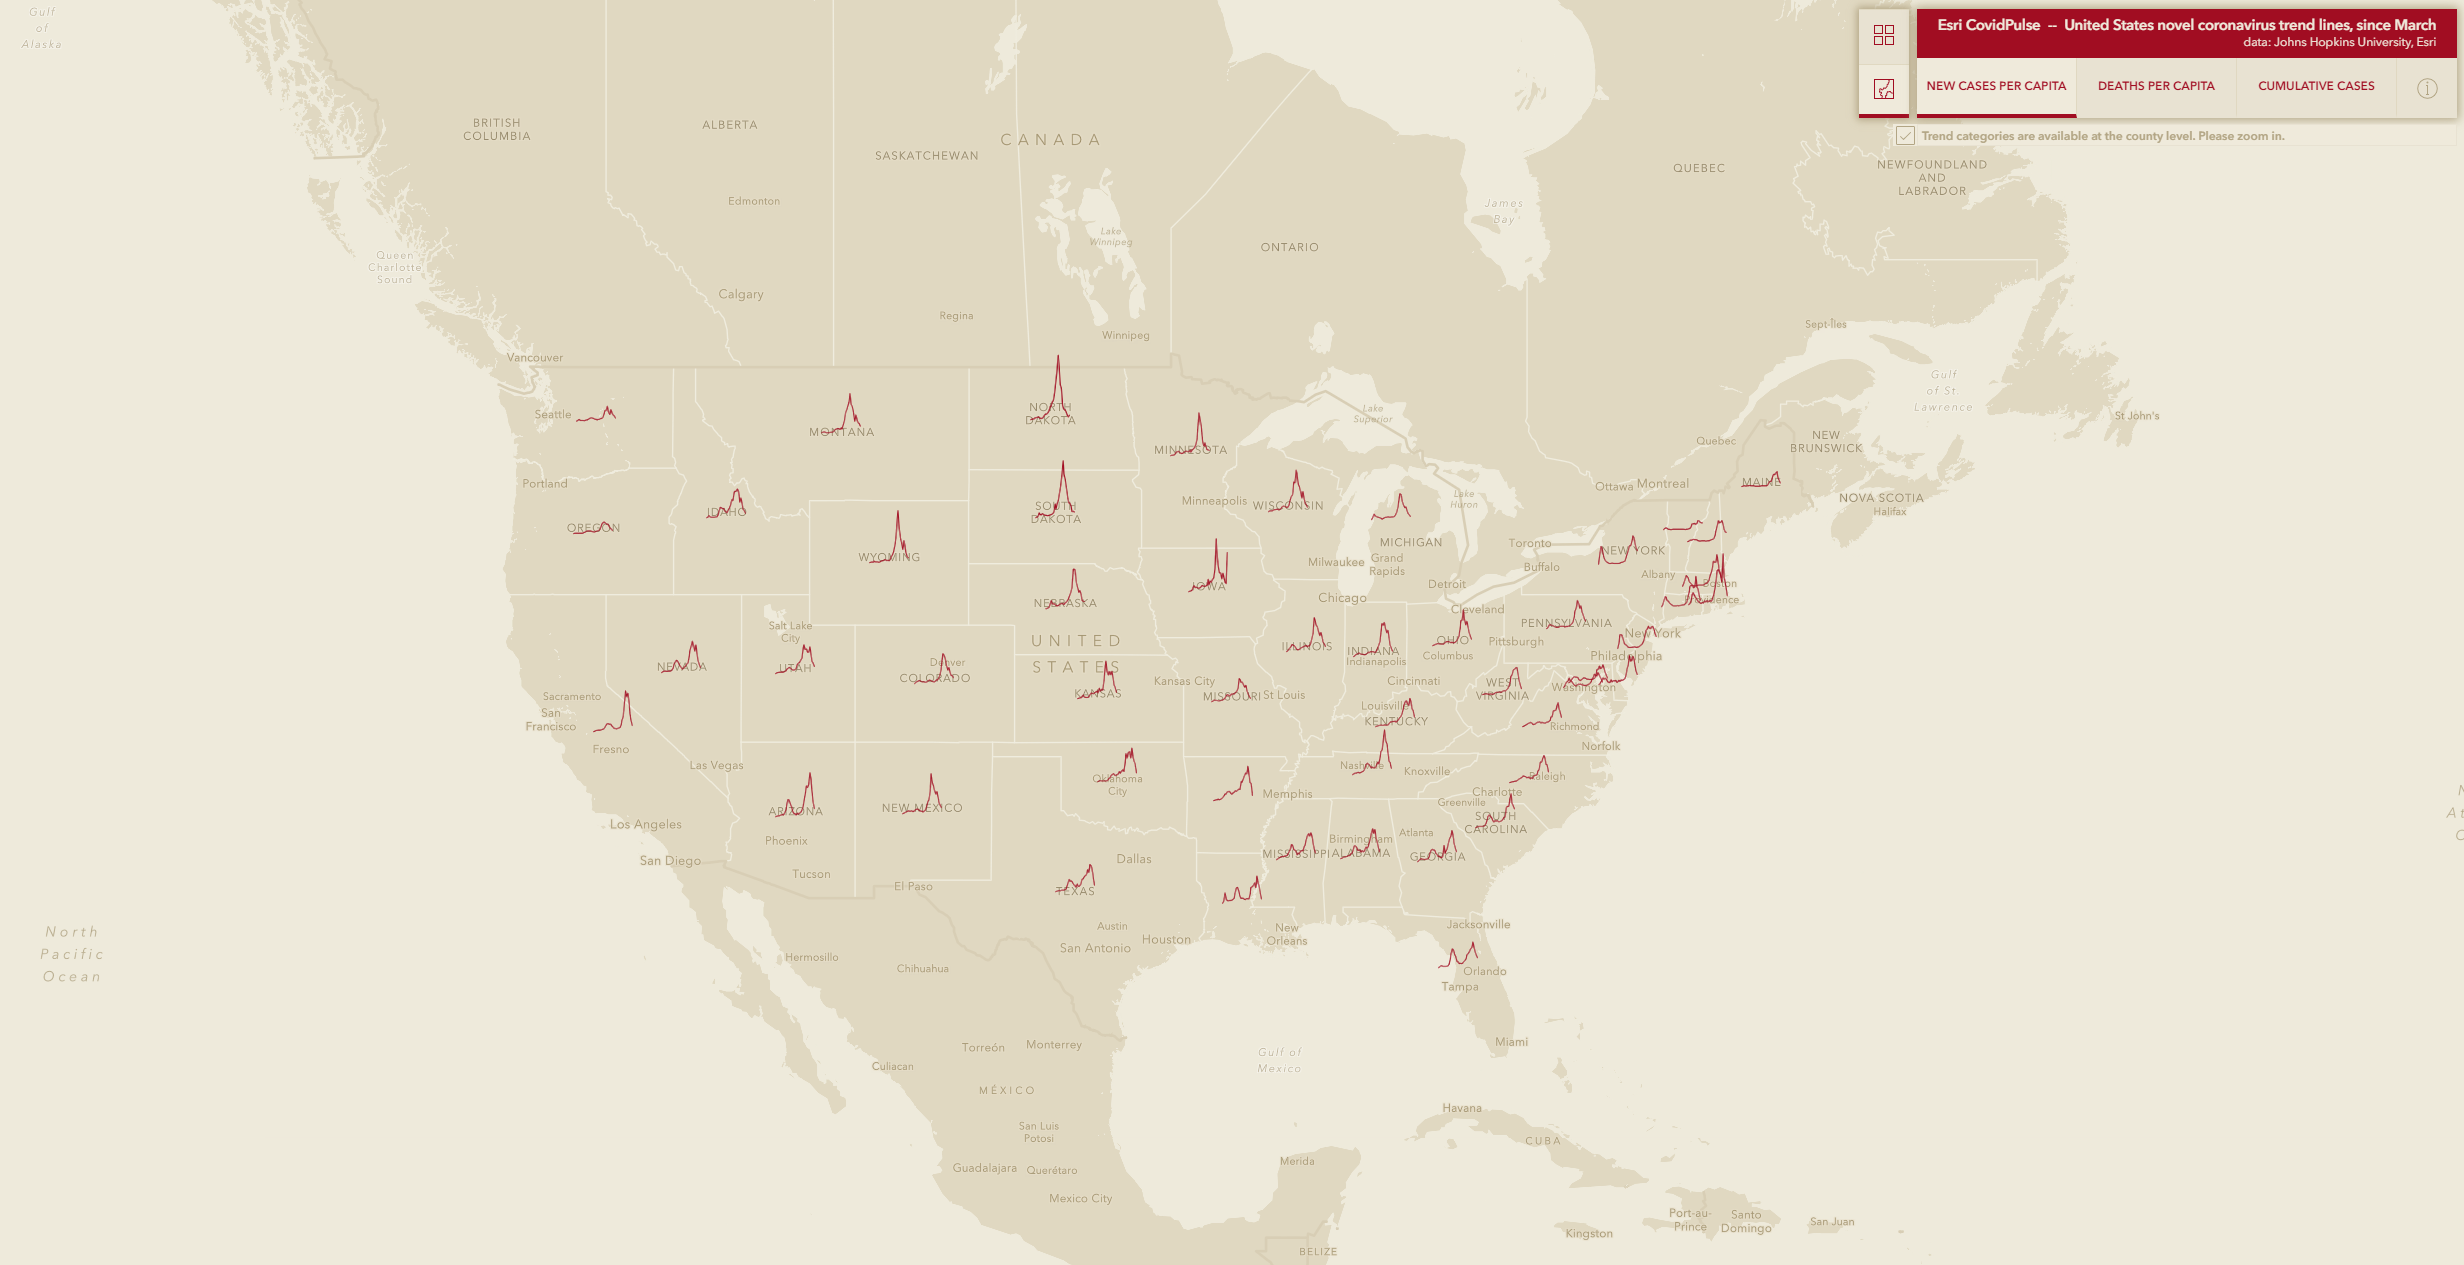
Esri’s CovidPulse Dashboard (above) shows new cases per capita in each state. Image courtesy of Esri.
As we noted in a previous post, GIS tools like Esri’s CovidPulse Dashboard and the Johns Hopkins University tracking dashboard have helped with monitoring the spread of the virus. Other tools were used to distribute tests, like at Mayo Clinic’s Jacksonville, Florida campus, where autonomous vehicles delivered COVID-19 tests and medical supplies.
In distribution efforts, similar tools can be put to use for planning, tracking, and publicizing vaccine progress. GIS is well-suited as a tool for addressing location-based needs specific to vaccination efforts. By using different types of spatial data, vaccination efforts can be adjusted region by region or even city by city.
GIS’s ability to incorporate layered data means it is an excellent resource when finding and assigning vaccine administration sites. It can help to identify locations where ample cold storage exists while also identifying facility staffing levels and capacity for parking and foot traffic.
Decision-makers can plan for many different scenarios by leveraging spatial data. Knowing ahead of time what situations might cause cold storage to become limited, or where adverse weather conditions could spoil vaccine doses is invaluable information.
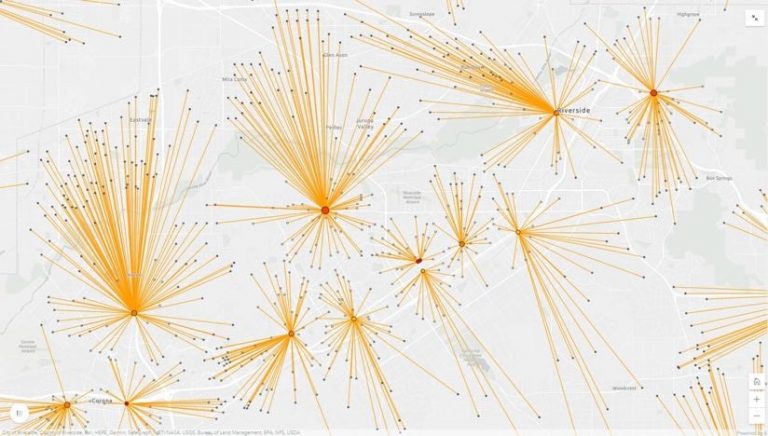
Spatial data is key to planning for optimal vaccine distribution. This is a sample vaccine venue map in which red dots indicate capacity for ultra-cold storage, and yellow dots indicate normal cold storage. Dot size indicates overall capacity. Lines represent drive time and distance to the potential distribution site from various population centers. Image courtesy of Esri.
Utilizing GIS in the planning stage also means decision-makers can learn where priority populations reside and design a vaccine distribution plan suited to reach them. Population data, layered under infrastructure data, can be used to ensure the most accessible sites are chosen. Physical distance may not always be the best indicator of accessibility, either – many datasets include information like bus routes, construction information, and languages preferences, among other factors that contribute to accessibility.
Once vaccines are being delivered and administered, location-based information can help develop a tracking system for who has taken both doses of the vaccine, as well as inventory management systems. This will decrease both confusion and wasted doses of the precious vaccines. This aspect also plays into a another important aspect of vaccine distribution: transparency.
Esri’s public-facing solution for the COVID vaccine, called the Coronavirus Vaccine Outreach solution, functions as a window into vaccination progress. It can be used to informally track progress, but also to illustrate official decisions and the rationale behind them. Official announcements paired with visible data help create a path toward greater trust between communities and their leaders. These kinds of solutions can also help individuals determine their eligibility for vaccination and find the best location to receive one, should they qualify.
The Transformation & Increased Accessibility of GeoINT
The shift toward accessibility in GeoINT means that all kinds of consumers, be they NGOs, academic outfits, or commercial endeavors, are finding it easier to integrate finished geospatial intelligence into their workflows.
The avalanche of open data, both historical and current, and analyst-freeing automation processes are ensuring that GIS-powered research remains top-shelf intel sitting within reach of an ever-expanding customer base. This touches the study of everything from drone proliferation to coal exports, from drug trafficking to oil infrastructure, from protest analysis to airfield activity.
A government might want to know if new military bases are being built by a neighbor. A private business may want to monitor the construction of a competitor’s new facilities. In these pursuits, change detection is invaluable. Add to that analysts capable of imagery classification, and the makings of an executable plan are clear.
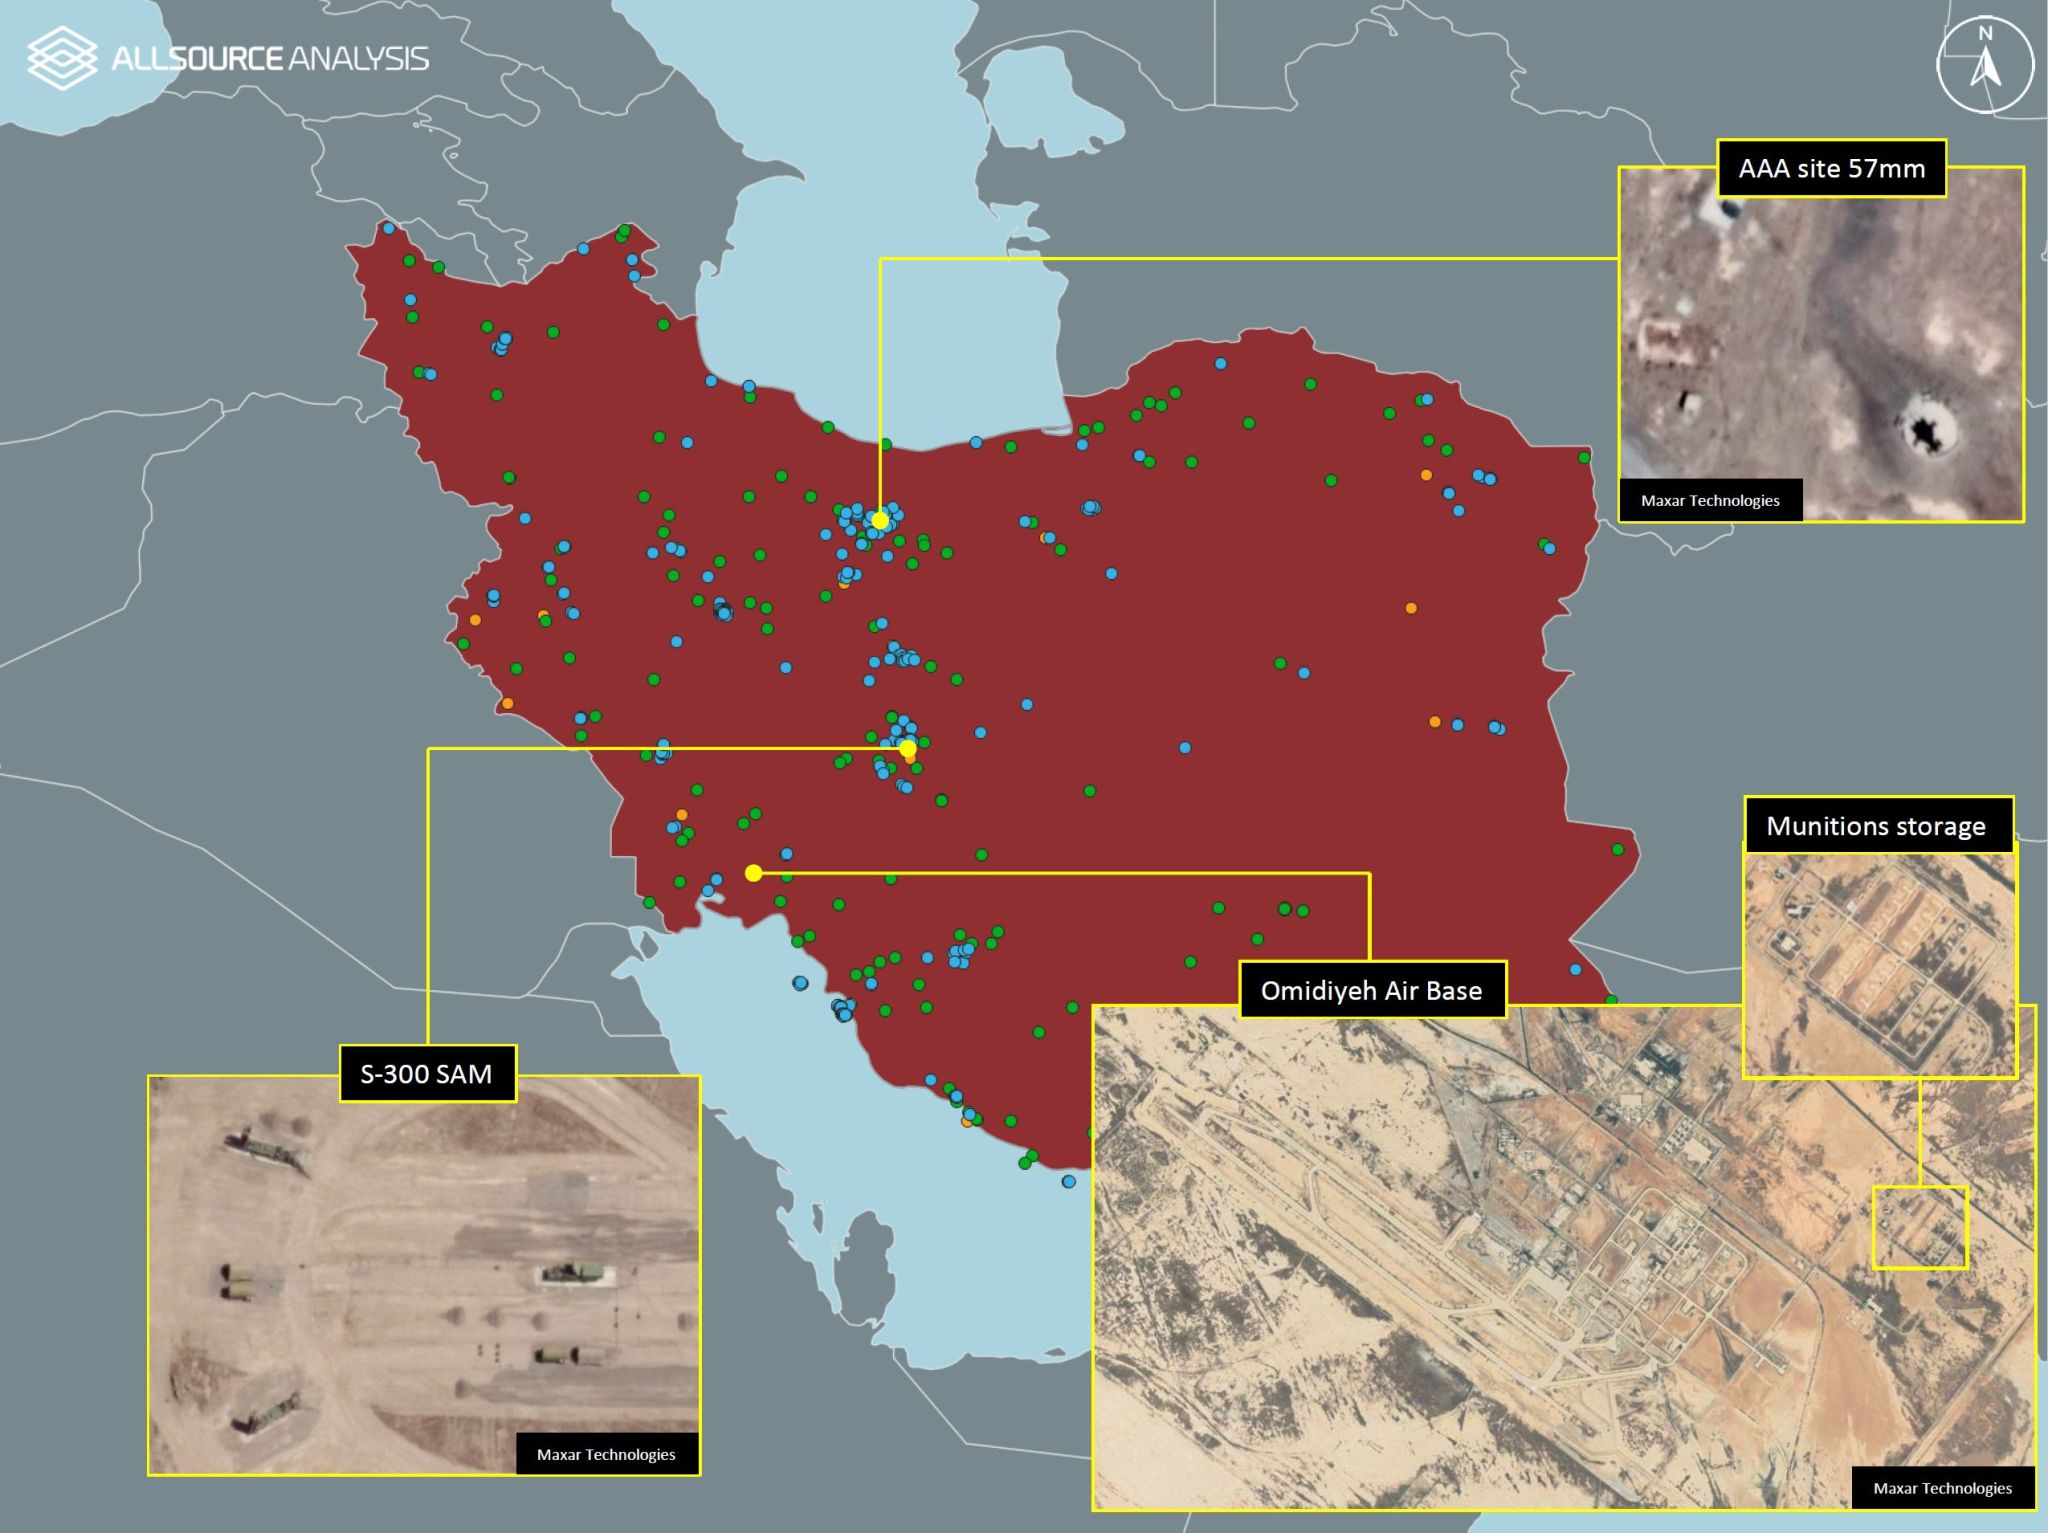
GeoINT datasets can contain various types of information. This one shows the locations of both civilian & military infrastructure in Iran. Image courtesy of AllSource Analysis.
Capturing raw data and turning it into actionable intelligence once required that an entity own (or at least have access to) dedicated satellites and a fully-staffed-and-funded team of expert analysts. Today, as accessibility and demand rise, methods of delivery are transforming, too. Maxar’s recent launch of an analysis-ready data subscription service provides one example, while AllSource Analysis’ network of top analysts and cutting-edge technology provides another.
Tasking imaging satellites to capture something they’re not already capturing is expensive, but the proliferation of satellites as SAR data’s prominence rises means the cost is coming down.
As noted in last week’s post, though, insight is different than information. All the raw data in the world isn’t of much use without specialist knowledge of how to interpret and manage it, and that takes expertise. Without expert eyes, connections between, say, social media data and regional topography might go unnoticed and unleveraged. Fortunately, the capacity to analyze raw satellite imagery and perform image classification is growing as the ranks of capable analysts increase.
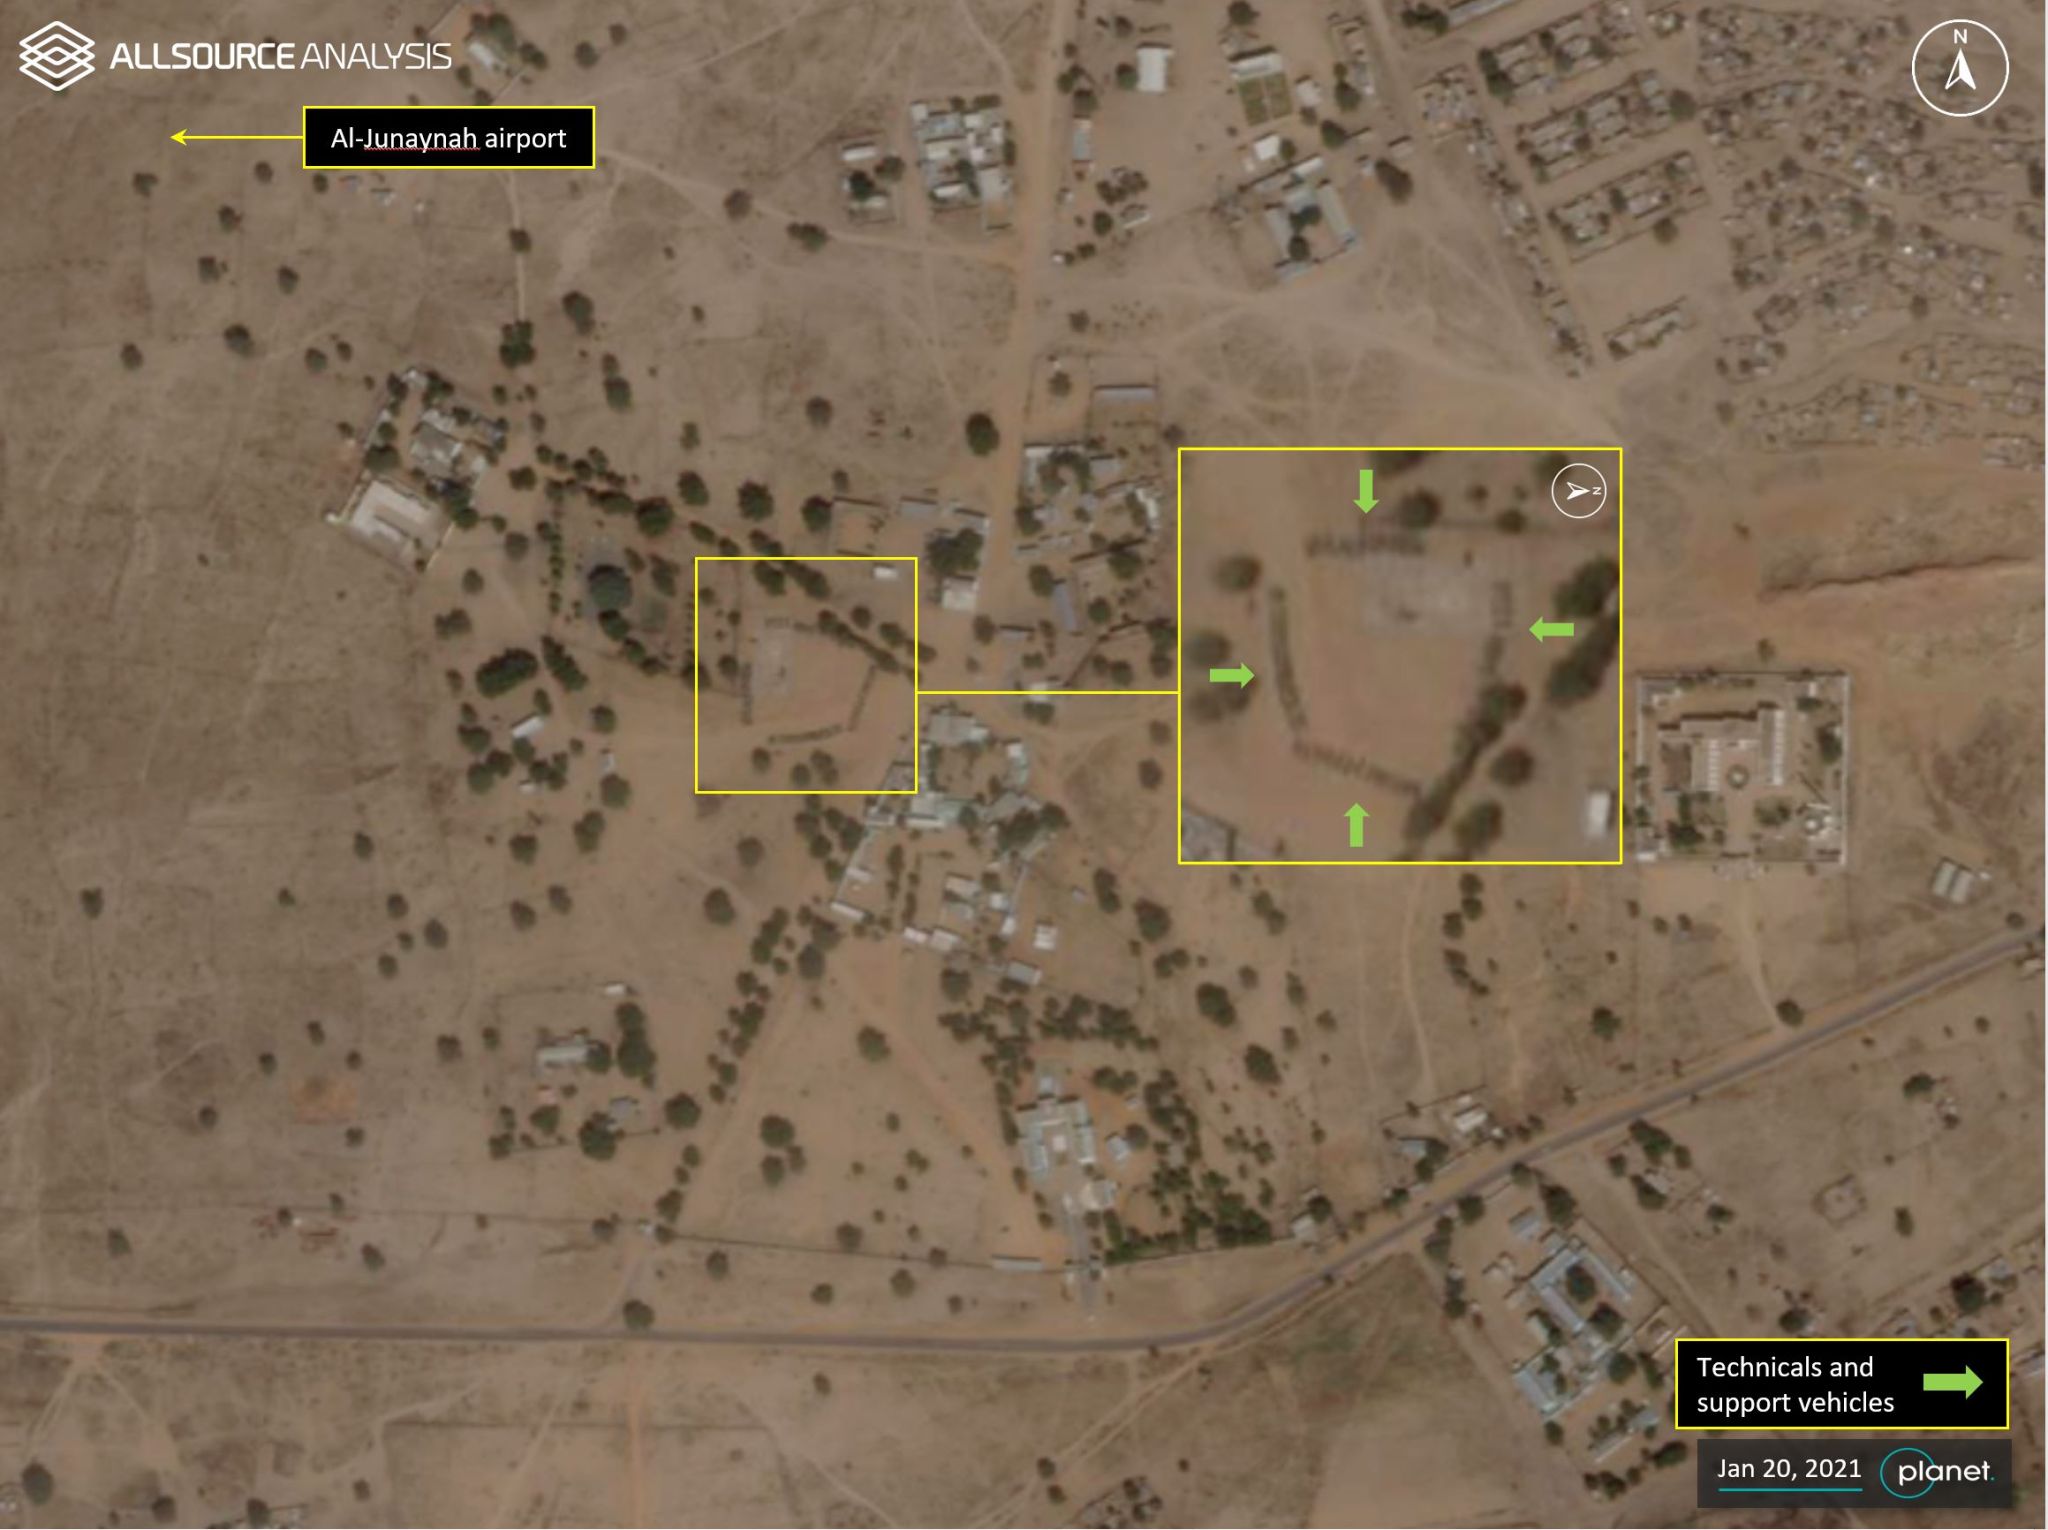
Change detection in imagery is an important part of GeoINT analysis. This image shows an increase in armed vehicles. Image courtesy of AllSource Analysis.
Those analysts are benefitting from a refinement of workflow efficiencies. As AI and machine learning processes speed up previously tedious aspects of the process, the human components are freer to make connections and draw conclusions.
The result of all this? There is more GeoINT data in the hands of more people than ever before.
The Human Role in GeoINT During the Age of Automation
Key Takeaways
- GeoINT agencies collect immense amounts of visual data that, traditionally, must be manually analyzed by humans.
- Automation, machine learning, and AI can help expedite workflows, but over-reliance on machines could diminish analysis quality. An automated eye in the sky can generate images of what’s on the ground, but an understanding of that image’s significance – tactically, economically, socially, or otherwise – is something that requires a human brain.
- Systems that balance human analysts and AI in a complimentary way retain the best of both automation and human cognition.
In 2017, Robert Cardillo, then Director of the National Geospatial-Intelligence Agency announced the NGA’s intention to automate 75% of its image analysis. In 2017 alone, that agency produced 12 million images and 50 million indexed observations, which required immense human work hours. A combination of artificial intelligence, augmentation, and automation was seen as a path toward saving time, money, and effort, while also increasing productivity and accuracy.
Clear benefits aside, automating geospatial intelligence is a more delicate balancing act than it might initially seem.
GeoINT is a discipline that divines meaning from data over time. An automated sweep of an image to run facial recognition is one thing, but repeatedly analyzing a space over time, while considering everything from economics and culture to architectural trends is something that requires human brains and their advanced, flexible cognitive abilities.
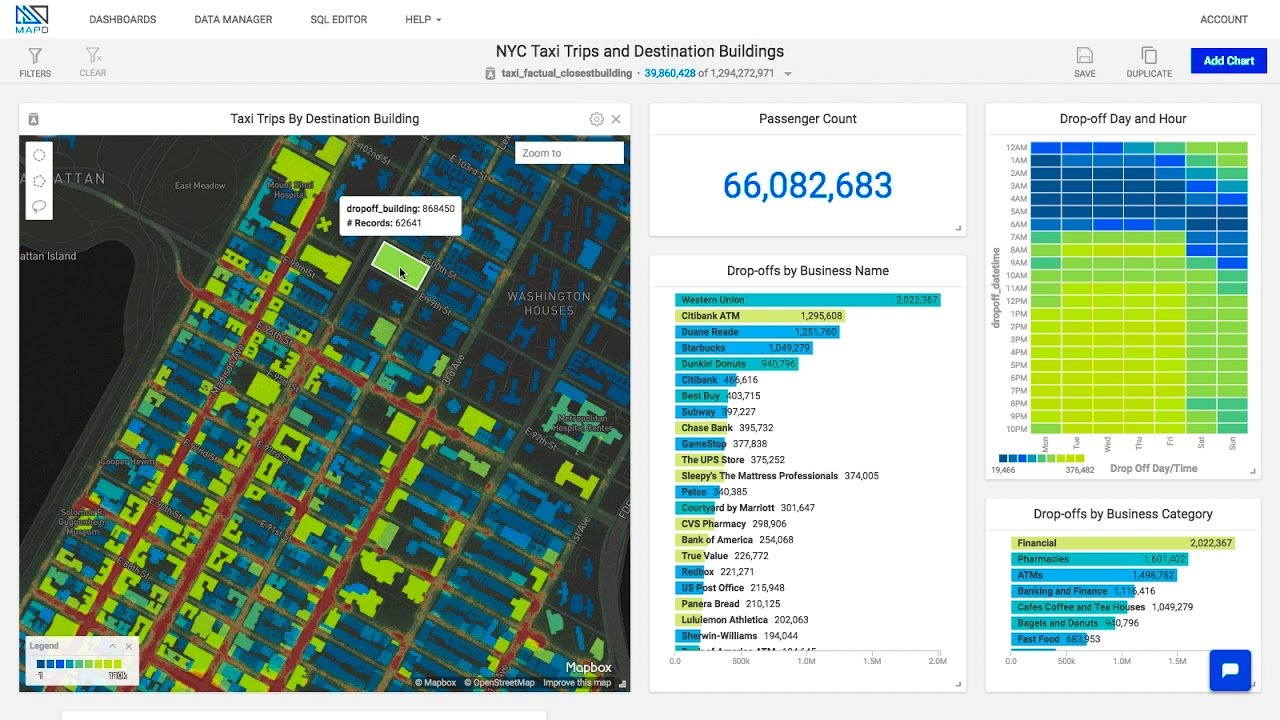
An example of GeoINT analysis with taxi trips and destinations in New York City. Image courtesy of OmniSci.
In our last post, we referenced how workout tracking app, Strava, pivots user data into useable information for city planners. Their data provides remarkable insights, in part, because it was generated by human users keenly interested in finding the ‘best’ routes through a given city. Analysts working on the data they generate know this, too, and it bolsters the value of their end-product.
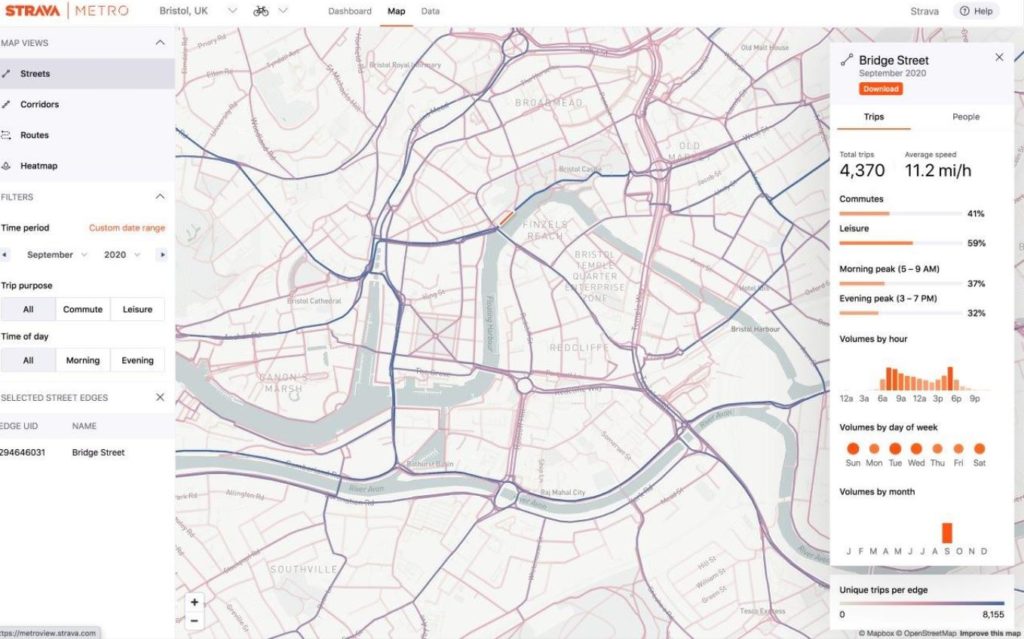
An example of human-generated data in Strava Metro. Image courtesy of Cycling Industry News.
Rather than design systems of automation that seek to circumvent the human element – it is important to have human eyes and brains in the process as verifiers. As this excellent Trajectory Magazine article puts it, an ideal system would follow a ‘human-in-the-loop’ model of analysis.
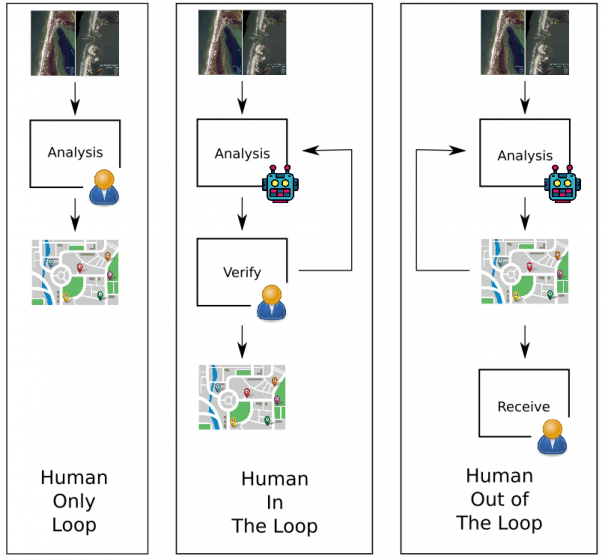
A diagram showing the “Human-in-the-Loop” analysis model. Image courtesy of Trajectory.
Human cognition’s flexibility means our brains can process unexpected information or occurrences. Humans can divine context, see causal relationships inside a space, and draw information from seemingly disparate fields together to form a well-reasoned conclusion. We accrue expertise after experiences. On the other hand, human brains are subject to mental biases and distractibility. Machines, by contrast, can tirelessly perform repetitive tasks and find patterns with ease.
In short: leave the monotony to machines, and free human analysts up to handle the high-level analysis for which their brains are built.
Geospatial Intelligence for All
In 1961, the National Reconnaissance Office (NRO) was established and tasked with maintaining the United States’ intelligence satellite fleet, everything from drawing-board conception to data collection. The geospatial intelligence gleaned from this fleet has been used by the US’s intelligence community (the other four of the US’s ‘big five’ agencies: The Central Intelligence Agency, Defense Intelligence Agency, National Security Agency, and National Geospatial-Intelligence Agency).
The establishment of the NRO pointed to a then-obvious fact of Geospatial Intelligence (GeoINT): governments held the means of data collection, creation, and dissemination.
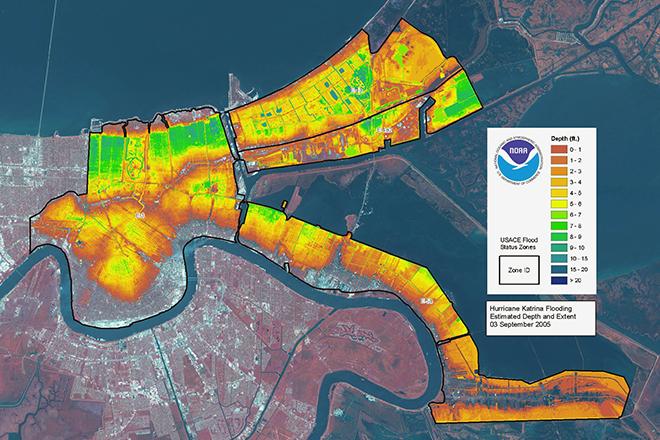
GeoINT image showing LiDAR flood depth data overlaid on a satellite image of New Orleans following Hurricane Katrina. Image courtesy of Penn State University, NOAA, and ESA.
A recent restructuring of responsibilities indicates a shift in that idea. In 2017, the NRO took over responsibility for imagery acquisition from the National Geospatial Intelligence Agency (NGA). The NGA still dictates what imagery is needed, and the NRO collects it, but now utilizes Requests for Information (RFIs) from industry in that pursuit.
In 2019, the NRO awarded significant contracts to Maxar, BlackSky, and Planet in an effort to better understand the quality, quantity, and kinds of available commercial data. As these kinds of interactions between the US government and commercial entities continue, the intelligence community will learn more about what commercial capabilities exist and the commercial sector will hone its understanding of what imagery and intelligence the NRO might require next.
This signals a sea-change from government-generated GeoINT to commercially produced data and analytics.
Why the shift, though? As spatial data, machine-learning, and other aspects of GeoINT have grown in the commercial sector, the government sees potential for data superior to that generated by government departments.
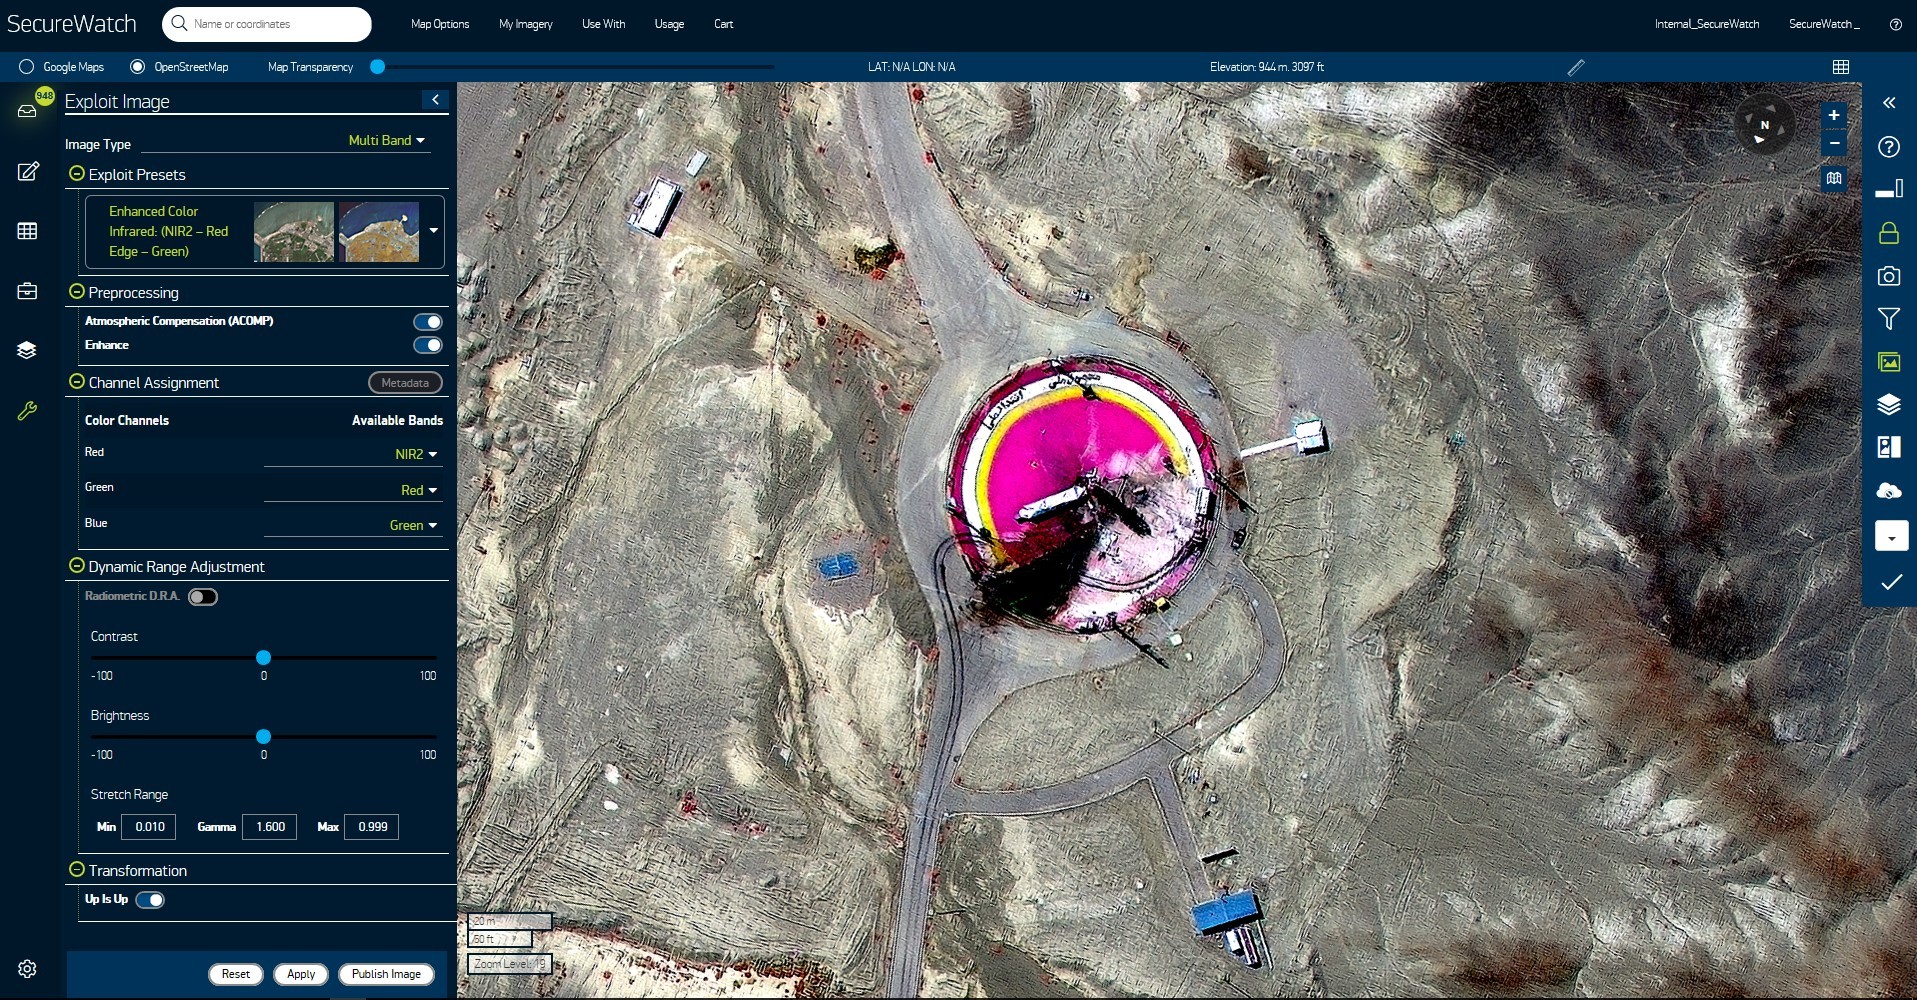
Analysis tools in programs like Maxar’s SecureWatch (pictured here) enable users to perform multi-spectral analysis of different events, like this failed missile launch at Semnan Space Facility in Iran in 2019. Image courtesy of Maxar.
This isn’t just a federal-level dynamic; municipalities working on city transportation plans provide a clear example of the shift from public to private geospatial data generation. In the past, when a city decided to build new roads or modify some aspect of its transportation system, a mapping survey team might have gone out to collect raw data. Today, that data will likely come from a private company’s vast stores of user-generated geospatial data.
Companies like Strava Metro, a product of workout tracking app Strava, use aggregates of user data (stripped of identifiers) to illustrate popular walking, running, and biking routes through cities. Individual athletes can use this data to find new routes (or, in the age of Covid, routes that avoid others runners). In the hands of municipalities, however, this data can be used to better inform city planning efforts when new bike lanes and recreation loops are being worked on. Data from Strava Metro gets into as granular of details as which way people travel down certain streets. Cyclomedia, a Dutch company providing street-level data created with LiDAR and traditional imaging methods, takes a similar approach, marketing their information to utility companies.
The same is true for data originating from commercial efforts to automate vehicles. To ‘teach’ Cadillacs to drive autonomously on highways, aspects like slope of road, lane delineations, and other data were collected by Ushr, Inc. In-city autonomous driving would require equipping luxury vehicles with cumbersome LiDAR devices, which violate Cadillac’s aesthetic principles, but city busses have more freedom in that regard. The data Ushr generated could very well be used in service of making a fleet of city vehicles autonomous.
In city environments increasingly rich with active pedestrians, autonomous vehicles, and an enormous amount of user-generated geo-tagged GeoINT, it seems more and more likely that planners at every level of government will wind up turning to privately-created data and services to continue building the cities and communities of the future.
The Bright Future & Potential Impacts of SAR
As SAR data becomes more affordable and accessible, the geospatial industry will adapt with it. Just how precisely SAR’s impact will be felt remains a big question mark at this stage. Nonetheless, the excitement is palpable. Still, plenty of new technology gets hype and fades away; what makes new tech become standard tech is its ability to replace what came before it.
SAR has that ability, considering its edge over optical imagery with regard to weather factors and nighttime imaging capabilities.
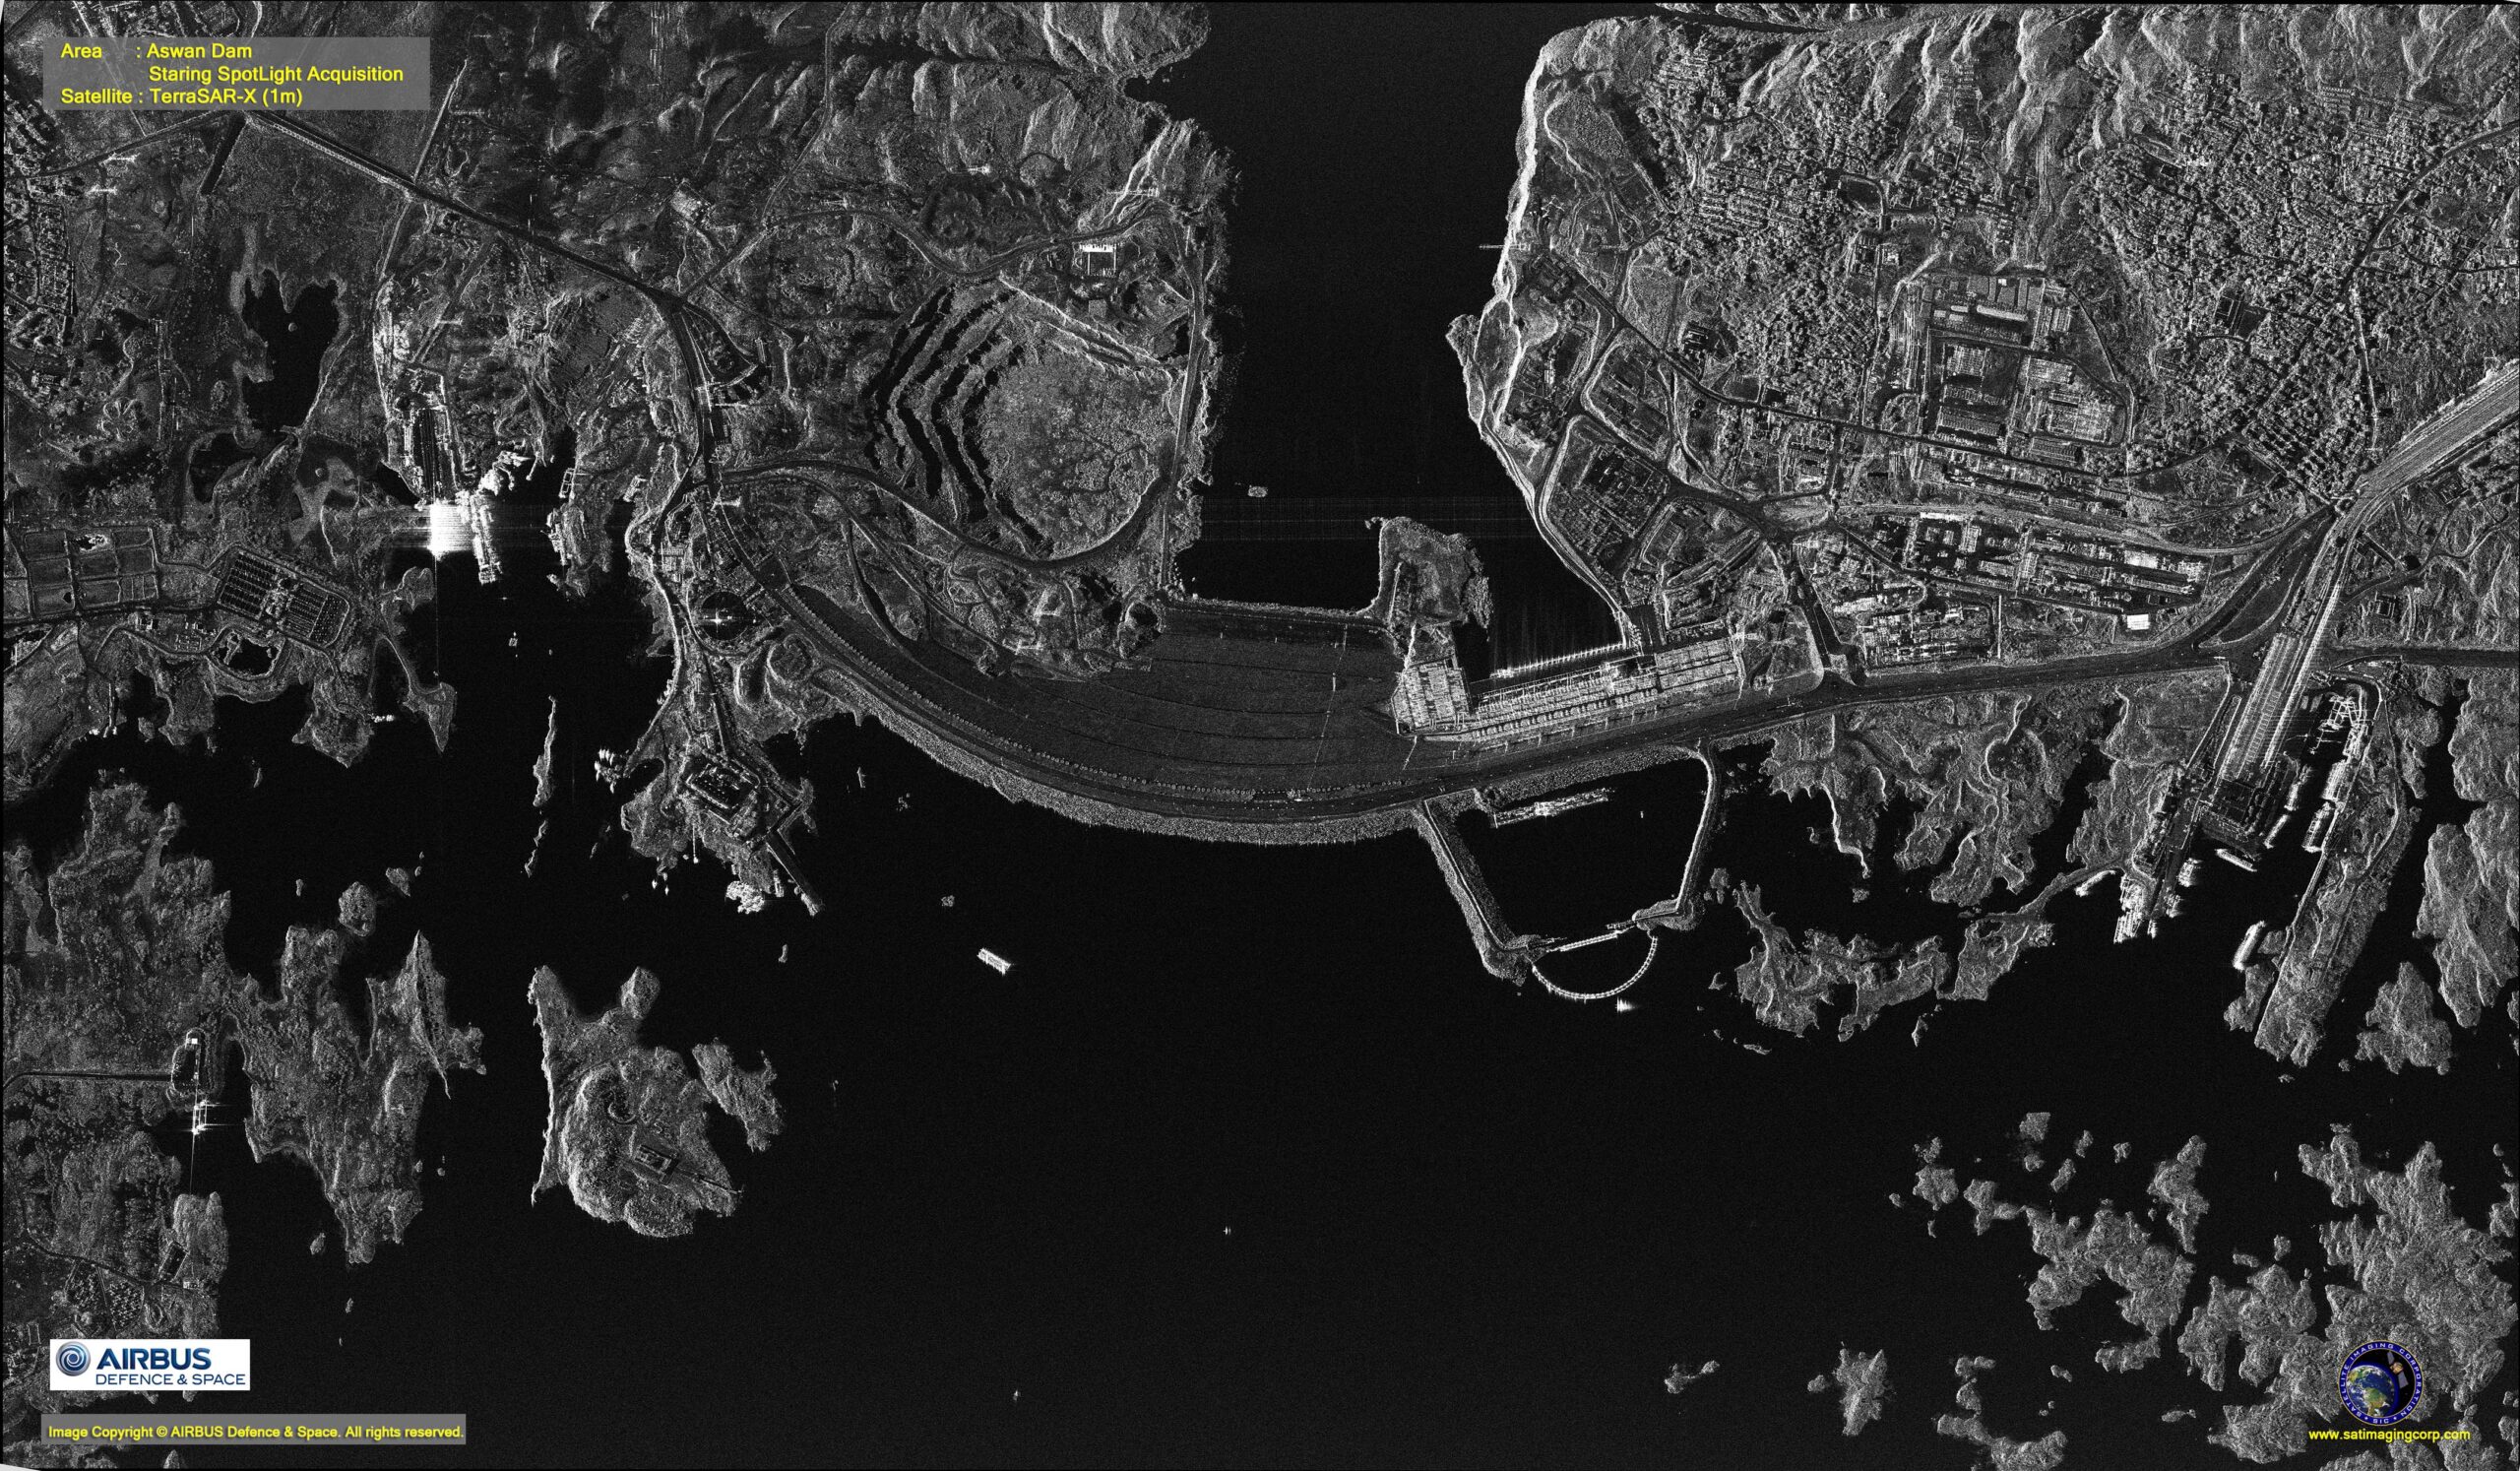
SAR image of the Aswan Dam in Egypt. Image courtesy of Satellite Imaging Corp. and Airbus Defence & Space.
For years, SAR technology and data was mostly in the domain of governments. Its capabilities and usefulness have been well-proven, but principally for entities with enormous resources at their disposal. For example, imagery analysts from National Geospatial-Intelligence Agency (NGA) design workflows to regularly ingest SAR and make it useful. But that is only beginning now in the private sector.
Thanks to companies like Capella Space, which is continuing to launch its own constellation of SAR microsatellites, the technology is starting to creep out from behind government curtains.
East View Geospatial is an early reseller in North America for Capella Space, which now has the highest resolution commercial SAR imagery in the world. Four months ago, Capella launched its first operational satellite, Capella-2, a 107kg microsatellite that enters space the size of a washing machine before transforming in orbit. Data from that satellite is capable of producing 50 cm x 50 cm radar images – a level of detail that, when coupled with worldwide tasking capacity, unlocks even more potential and opportunities.
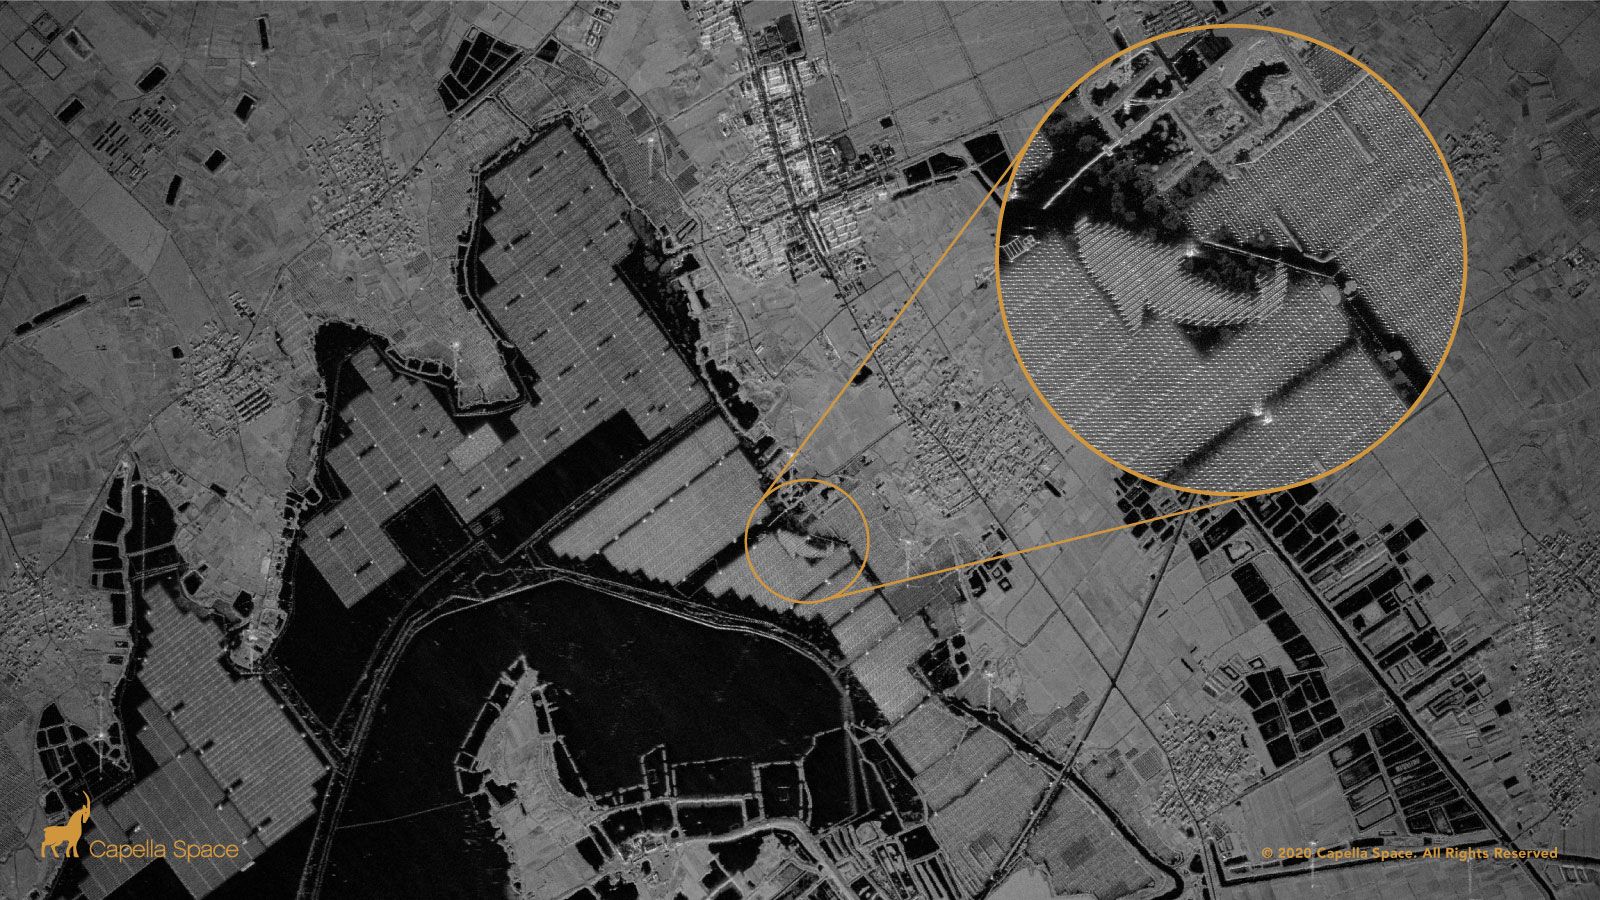
A SAR image of Tiangang Lake Solar Farm in China. Image courtesy of Capella Space.
The most obvious opportunity is nighttime imaging. Current commercial satellites are designed with sun synchronous orbits that generally image during peak sunlight hours – 10:00 a.m. or 1:00 p.m. This leaves tracking of nocturnal changes and information difficult to procure. With SAR satellites dotting the sky, capabilities for nighttime research and data collection, we believe, will blossom.
The shift will not occur overnight, however. Most industry professionals are trained in optical imagery and will have to learn to use SAR and the analytical tools associated. As companies like Capella launch more and more satellites, though, we predict an explosion of research and development around SAR data and analytics. This will eventually lead to academics crafting new theories and testing new applications, and on the commercial side, companies developing new and innovative tools for big data and SAR-focused algorithms.