Humanitarian crises come in many forms. But whether violence, water scarcity, famine, viral outbreak, or a natural disaster, they all share a common enemy: Geospatial data.
Crisis Management
In a humanitarian crisis, knowing the lay of the land is critical, especially for field teams coming from outside the affected area. The CDC’s field epidemiology manual even lists generating generic maps as a primary step in crisis response set-up.
Understanding natural and built environments is crucial for setting up operations and delivering supplies. Meanwhile, deeper data integration, like population data, helps determine need and aids logistics.
GIS data is already a proven necessity in matters of supply logistics, given its ability to cross-reference diverse data like weather, road closures and conditions, and population data.
This becomes increasingly important in areas where non-government actors control swaths of territory. When there are no ‘official’ sources to turn to, satellite imagery and heat mapping, not to mention cell phone use tracking tools, can shine light into information dark zones. This capability can help supplies from falling into the hands of agitators rather than helpers.
Post Crisis Evaluation
In the aftermath of a crisis, geospatial data helps tell the world what happened. A grim example – GIS data has been used to map unmarked execution sites and mass graves by cross-referencing soil readings and plant growth patterns from similar sites in the past.
In her 2018 speech to GEOINT, Linking the World CEO Mina Chang put forth a clear vision of ways the geospatial and big data industries can empower humanitarian causes. The results, she postulated, could help prevent crises from arising in the first place.
The Future of Crisis Management – Prevention
Right now, organizations react to events that occur and funding goes toward fixing the situation, which Chang says is similar to treating a symptom but not the underlying disease. With the predictive power of geospatial data, this is a paradigm that could shift toward crisis prevention, rather than crisis response. The captivating visual nature of interactive maps may also spur donations toward preventative measures – much the way images of disaster inspire people to support relief efforts.
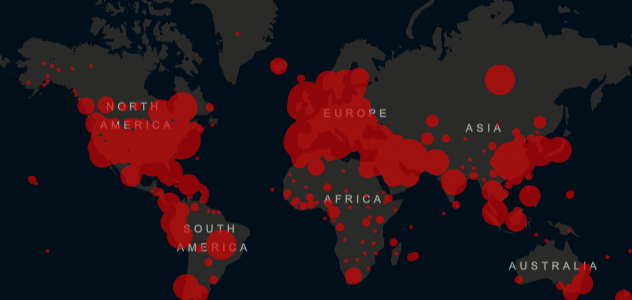
Analyzing a story map like the one, or the WHO’s ebola map, provides an invaluable window into the spread of a virus. This data is now used as a teaching tool for those who must respond to the next humanitarian crisis. Data-rich models can, as Chang says, give helpers a look into the future by analyzing past human and viral behaviors over landmasses.
Current Day Use Case
GIS logistics planning is already being used to combat the spread of COVID-19.
On March 30, 2020 at Mayo Clinic’s Jacksonville, Florida campus, autonomous vehicles began delivering COVID-19 tests and medical supplies.
To address the current pandemic on a global scale, there are tools like Esri’s COVID-19 Tracking Dashboard, which provides data to researchers, governments, aid workers and the general public in real time.
Key Takeaways:
- In current day, the use of geospatial data during humanitarian crises is critical for proper evaluation, tracking and response
- When there are no official sources to turn to, different forms of geospatial data, such as satellite imagery and population data, can be your only source of truth
- The focus needs to shift from humanitarian response to humanitarian prevention. By leveraging the ever-expanding geospatial databases and the many tools available, this vision of crisis prevention could become reality
- Interactive web-based maps can be an incredible tool for educating the world about the crisis whether that is real-time tracking or post-crisis evaluation and fundraising
Image Courtesy of Johns Hopkins University.