The ability to ‘see’ through darkness and weather events from space makes SAR data an invaluable asset in wide ranging endeavors from tracking changes in topography to sharpening responses to cyclonic storms, floods, earthquakes, oil spills, and other disasters.
Most recently, satellites operated by NASA’s Jet Propulsion Laboratories are providing SAR data for NASA’s effort to ‘see’ the COVID-19 pandemic from space. The initiative tracks changes in human activity as lockdowns are enacted and lifted across the globe.
This is a prime example of SAR data’s ability to enhance change detection capabilities. Because human activity occurs more or less regardless of light or weather conditions, optical data alone falls short in this project. SAR data’s unblinking look at patterns of human movement over a period of time, however, offers clear benefits.
SAR data is also capable of tracking change over much shorter periods of time than the recent lockdowns. In 2015, days after an 8.3 magnitude earthquake shook Chile, Alaska Satellite Facility scientists used SAR data from the Sentinel-1A satellite to create an image depicting an 8.5 cm line-of-sight motion.
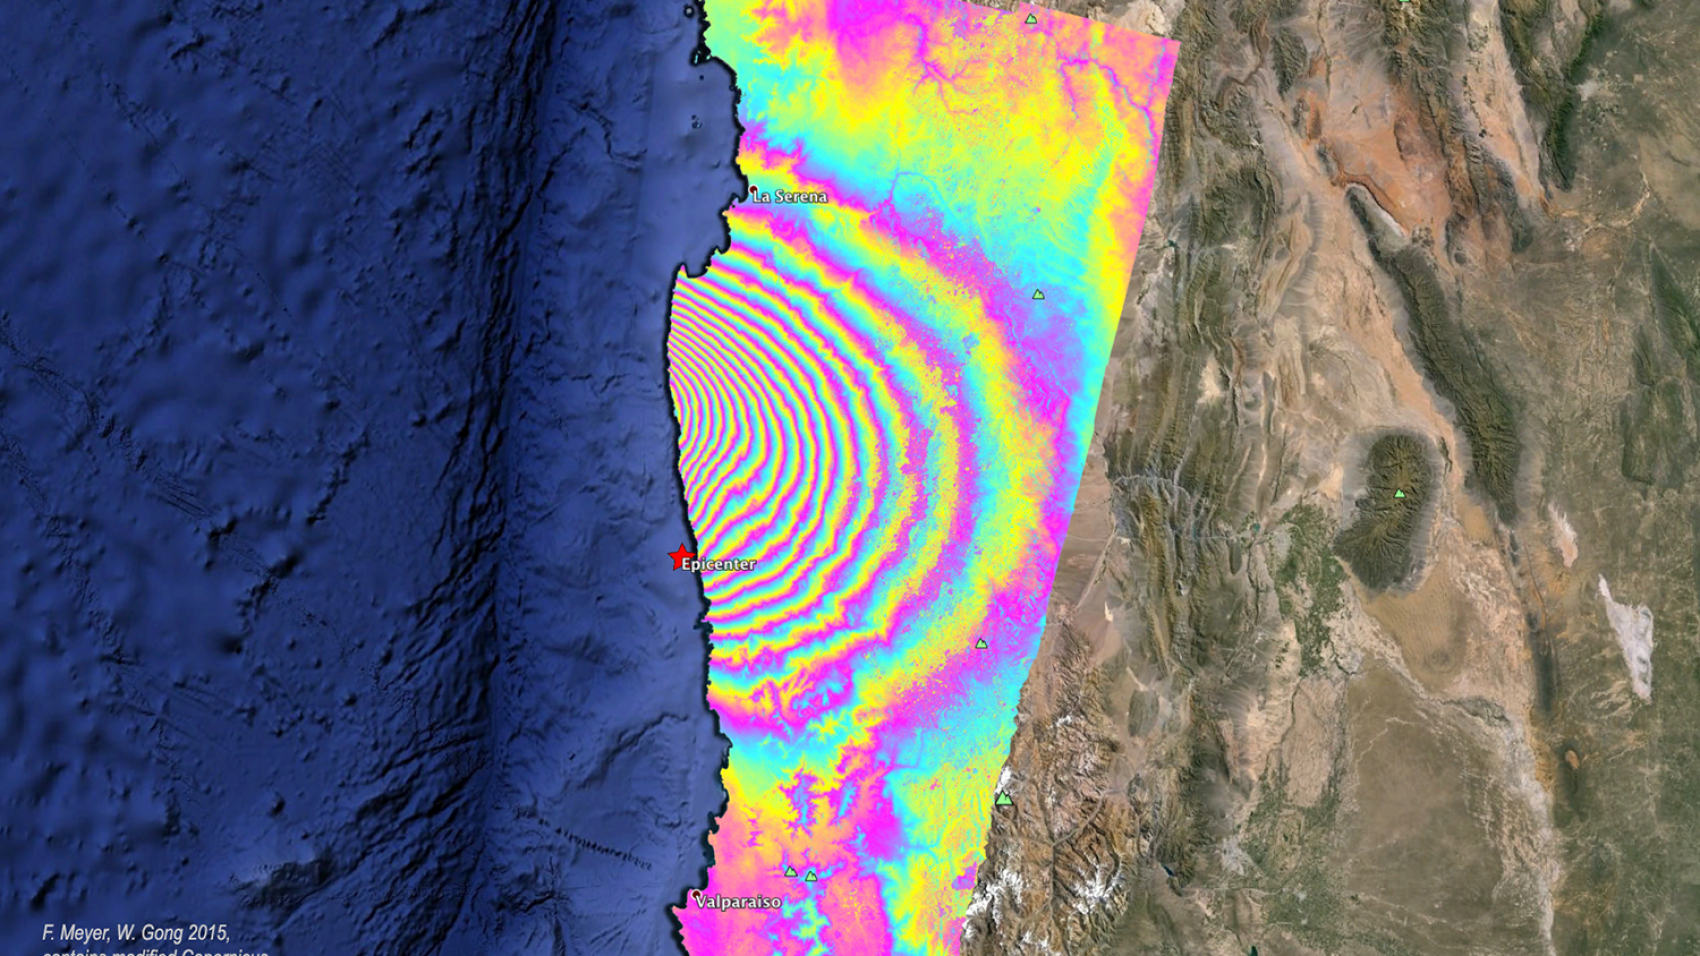
Image courtesy of The Alaska Satellite Facility, F. Meyer, & W. Gong (2015)
In 2010, SAR technology was instrumental in NASA’s efforts to support responses to the Deepwater-Horizon oil rig blowout. The data was used to (among other things) characterize oil in open water and track its progress toward coast and marshlands. In this instance, too, the ability to function irrespective of sunlight or weather is a clear and sound benefit.
That ability does come with some challenges. Namely, raw SAR data contains noisy images that require training and software to overcome. As more SAR data makes its way into the hands of users and experts, however, processes are being developed to make SAR data increasingly useable for those who have questions it might answer.
Studies, like this one by the Remote Sensing Division of Instituto Nacional de Pesquisas Espaciais, Brazil, work to alleviate issues of stabilization when imaging forests. That work enables faster progress on early warning systems for deforestation, which are key components for governmental forest reduction policies.
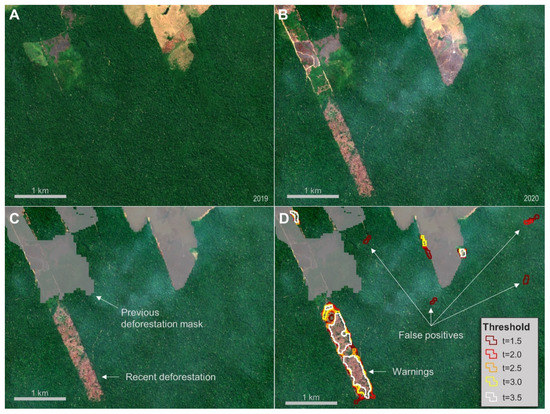
A figure showing how SAR data is used to detect deforestation in the Amazon. Image courtesy of Remote Sensing Division of Instituto Nacional de Pesquisas Espaciais.
Another clear example of the progress being made is SAR data’s ability to analyze icebergs. In 2007, researchers tracked sea ice in the Bering Strait with RADARSAT-1 data. A decade later, processes around deep learning and SAR data made even more detailed analysis possible. In October of 2017, the Statoil/C-CORE Iceberg Classifier Challenge contest used SAR data to help ‘machine learn’ the difference between icebergs and ships as part of an effort to drive down the cost of operating safely. In a similar challenge, efforts utilizing data fusion are underway to map power grids.
As innovations by experts cause end-user costs to fall and accuracy to rise, we can’t help but wonder what the growth of SAR data means for industries far and wide. Next week’s post will explore some of the technology’s potential impacts and legacies.